Fig. 4
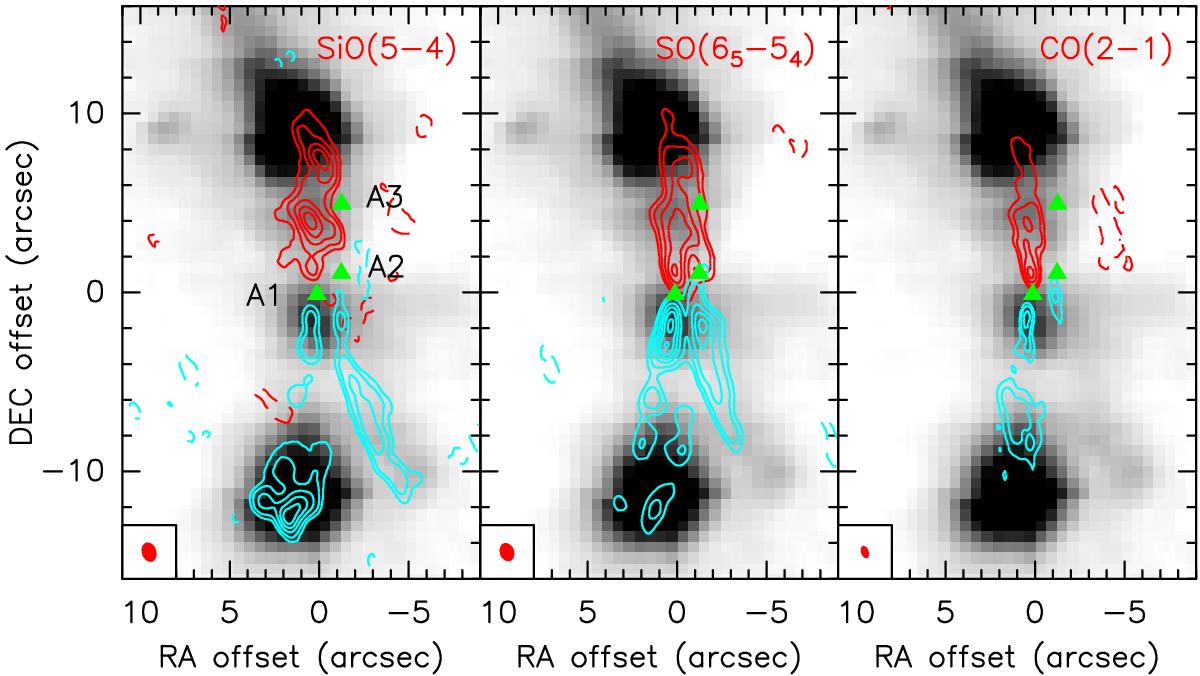
Left: the Spitzer-IRAC map of band 2 at 4.5 μm (grey scale) is compared with the SiO(5−4) map integrated in the blue- (−20, +5 km s-1, cyan contours) and red-shifted (+10, +55 km s-1, red contours) velocity ranges. Offsets are with respect to IRAS4A1. The contour levels of emission are traced at 5 and 8σ levels and increase in steps of 5σ, where σ = 100 mJy beam-1 for the red-shifted emission and 70 mJy beam-1 for the blue-shifted emission. Negative emission is shown with dashed contours starting at the 3σ level and decreasing in steps of 3σ. The positions of the continuum sources at 1.3 mm are marked in green. The PdBI synthesised beam (HPBW) is shown in the bottom-left corner. Middle and right: same as the left panel for the SO(65−54) and 12CO(2−1) emissions, respectively. The rms noise of the velocity-integrated maps are: σ = 110 mJy beam-1 and 90 mJy beam-1 for the red- and blue-shifted SO(65−54) emissions, respectively; and σ = 500 mJy beam-1 and 400 mJy beam-1 for the red- and blue-shifted 12CO(2−1) emissions, respectively.
Current usage metrics show cumulative count of Article Views (full-text article views including HTML views, PDF and ePub downloads, according to the available data) and Abstracts Views on Vision4Press platform.
Data correspond to usage on the plateform after 2015. The current usage metrics is available 48-96 hours after online publication and is updated daily on week days.
Initial download of the metrics may take a while.