Free Access
Fig. 1
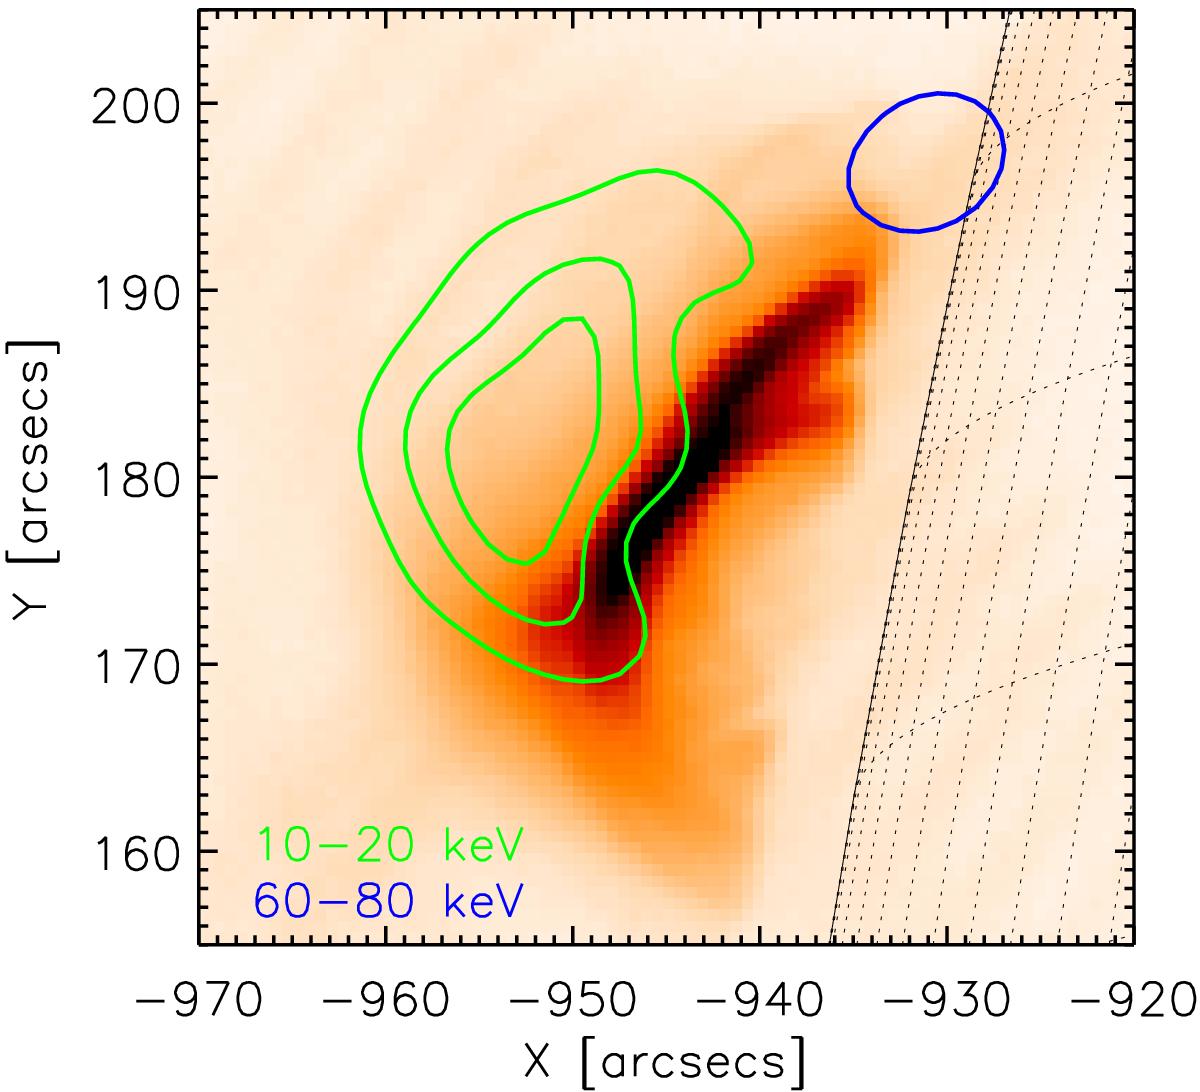
SDO AIA 94 Å image at 02:08:40 UT (red-orange background). RHESSI CLEAN contours at the time interval of 02:08 to 02:10 UT for 10–20 keV (green) at 30, 50 and 70% of the maximum, and for 60–80 keV (blue) at the 50% level.
Current usage metrics show cumulative count of Article Views (full-text article views including HTML views, PDF and ePub downloads, according to the available data) and Abstracts Views on Vision4Press platform.
Data correspond to usage on the plateform after 2015. The current usage metrics is available 48-96 hours after online publication and is updated daily on week days.
Initial download of the metrics may take a while.