Fig. 2
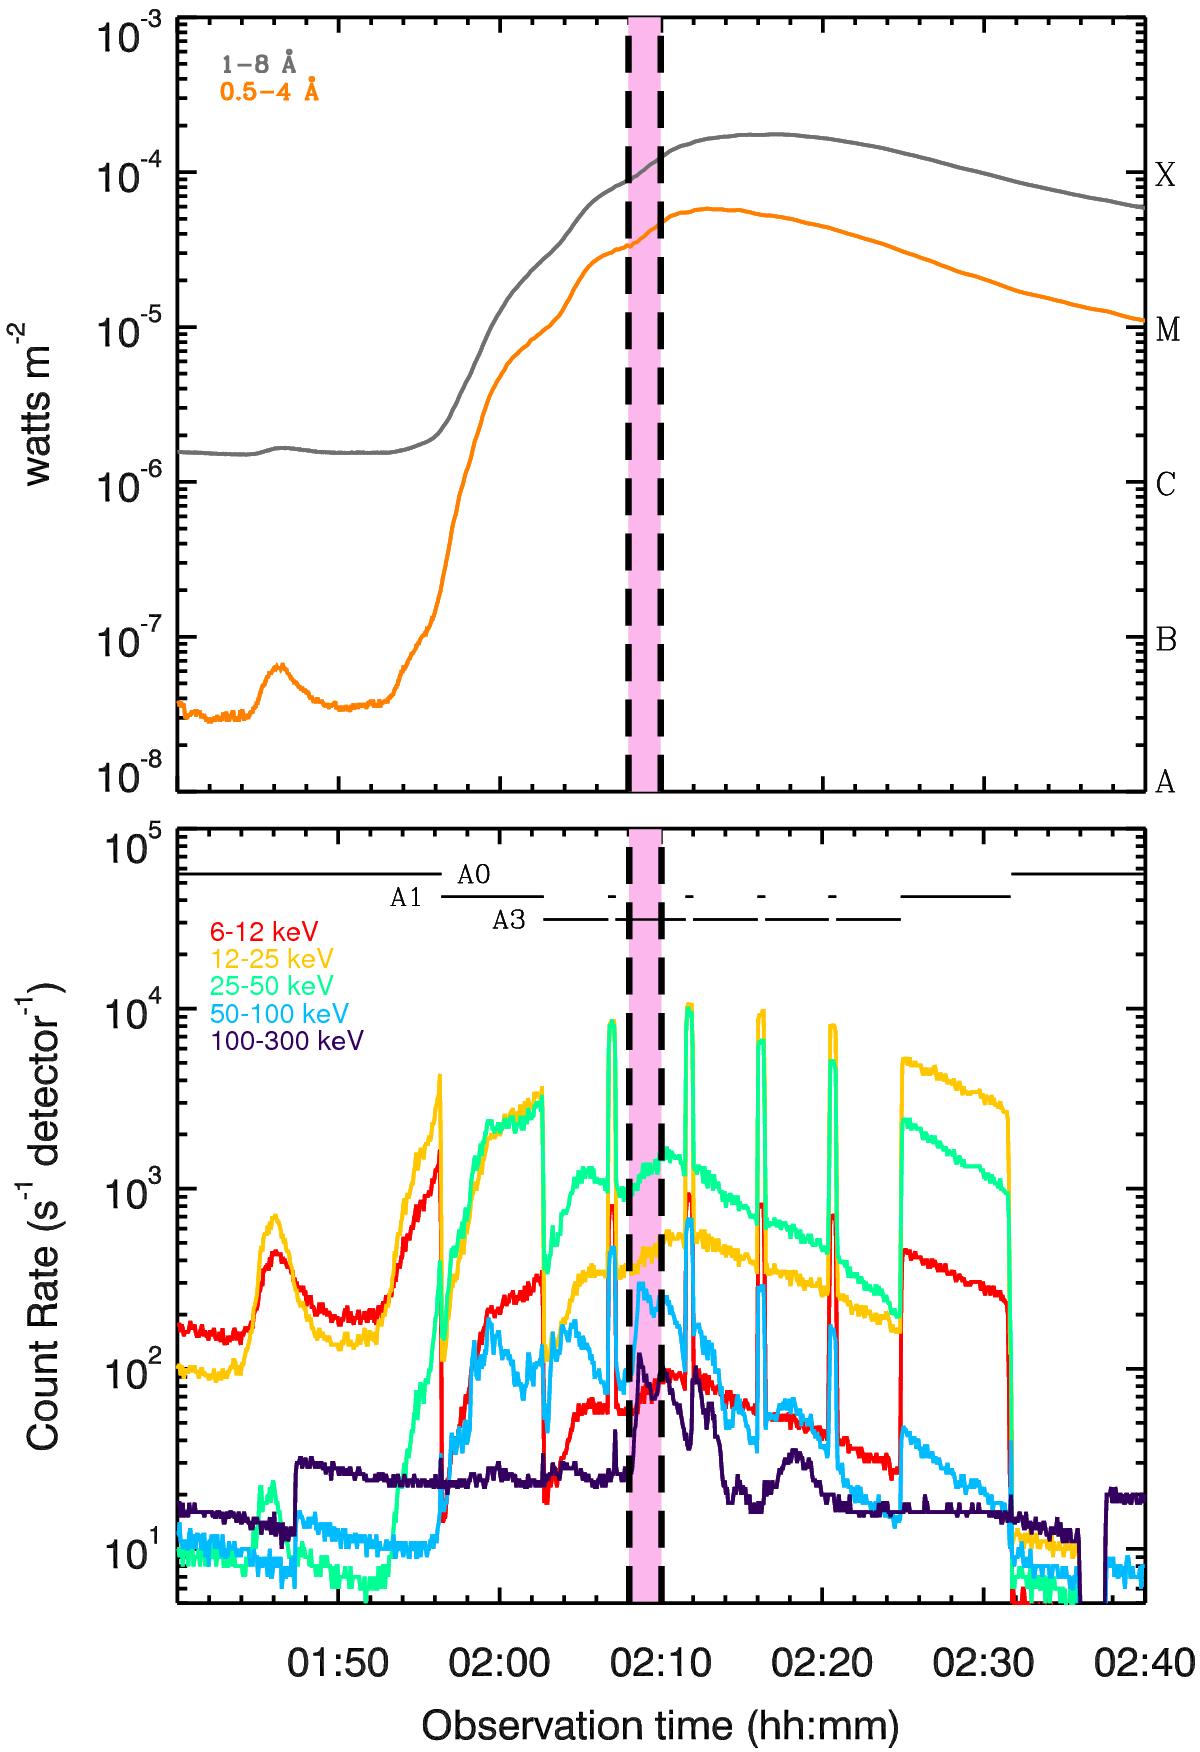
GOES (top: 1–8Åand 0.5–4Å) and RHESSI (bottom: 6–12, 12–25, 25–50, 50–100 and 100–300 keV) lightcurves for the chosen flare SOL2013-05-13T02:12. The two minute time of study from 02:08 to 02:10 UT is shown by the pink band between the two vertical dashed lines. The “jumps” in the RHESSI lightcurve occur due to instrumental attenuation changes reducing the X-ray flux reaching the detectors. At this time, RHESSI was in attenuator state A3, meaning that both the thin and thick attenuators cover the detectors.
Current usage metrics show cumulative count of Article Views (full-text article views including HTML views, PDF and ePub downloads, according to the available data) and Abstracts Views on Vision4Press platform.
Data correspond to usage on the plateform after 2015. The current usage metrics is available 48-96 hours after online publication and is updated daily on week days.
Initial download of the metrics may take a while.