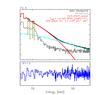
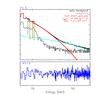
Fig. 3
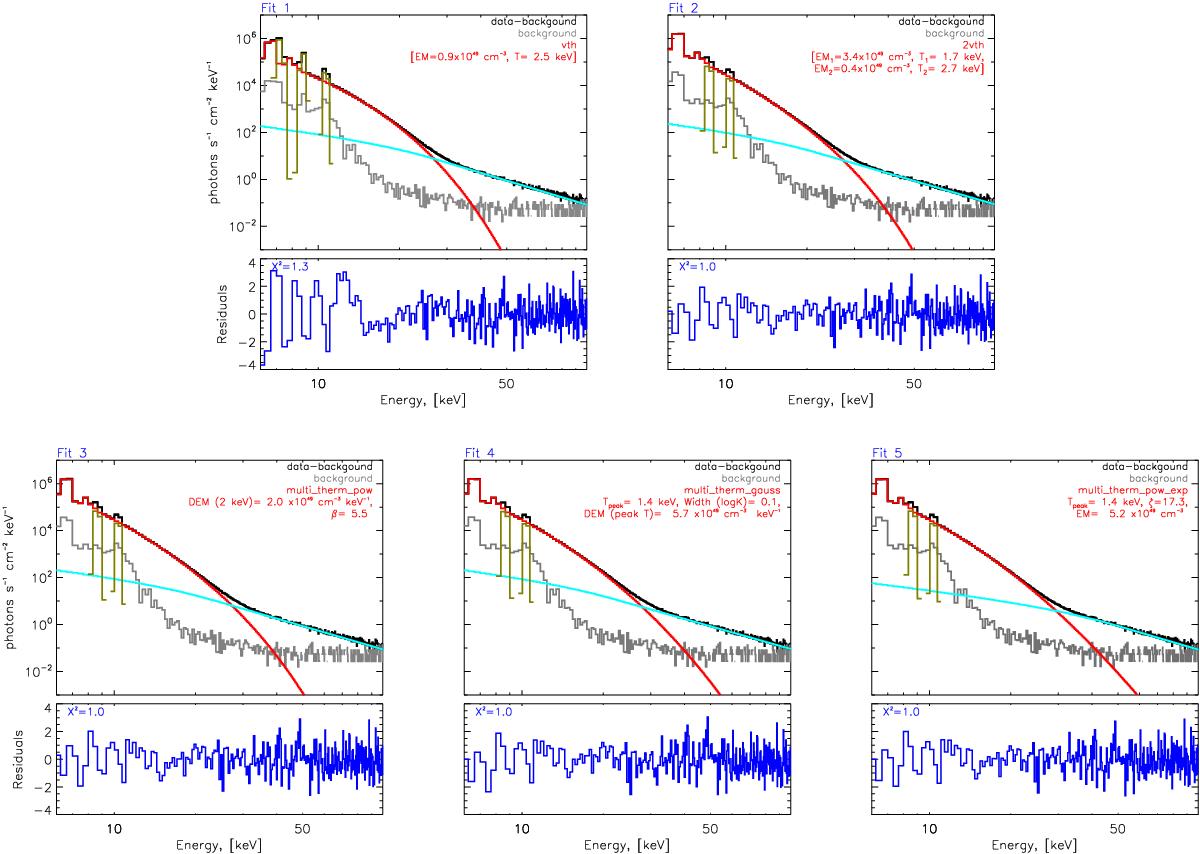
Photon flux spectrum fitted with different functions describing the thermal component. Top left: single isothermal, Top right: double isothermal, Bottom left: multi-thermal power law. Bottom middle: multi-thermal Gaussian in log 10T and bottom right: multi-thermal power-law and exponential. The normalised residuals are plotted below each spectrum, and each is created using only detector 6 and the functions fit the count spectrum between 6 and 100 keV for a chosen time interval of 02:08 to 02:10 UT. The values of all thermal parameters are shown in the figure and in Table 1. The gold lines in each panel represent Gaussian line fits (line) compensating for instrumental anomalies in the RHESSI spectrum. A thick2_vnorm function (light blue) is used to account for the non-thermal X-ray emission at higher energies.
Current usage metrics show cumulative count of Article Views (full-text article views including HTML views, PDF and ePub downloads, according to the available data) and Abstracts Views on Vision4Press platform.
Data correspond to usage on the plateform after 2015. The current usage metrics is available 48-96 hours after online publication and is updated daily on week days.
Initial download of the metrics may take a while.