Fig. 5
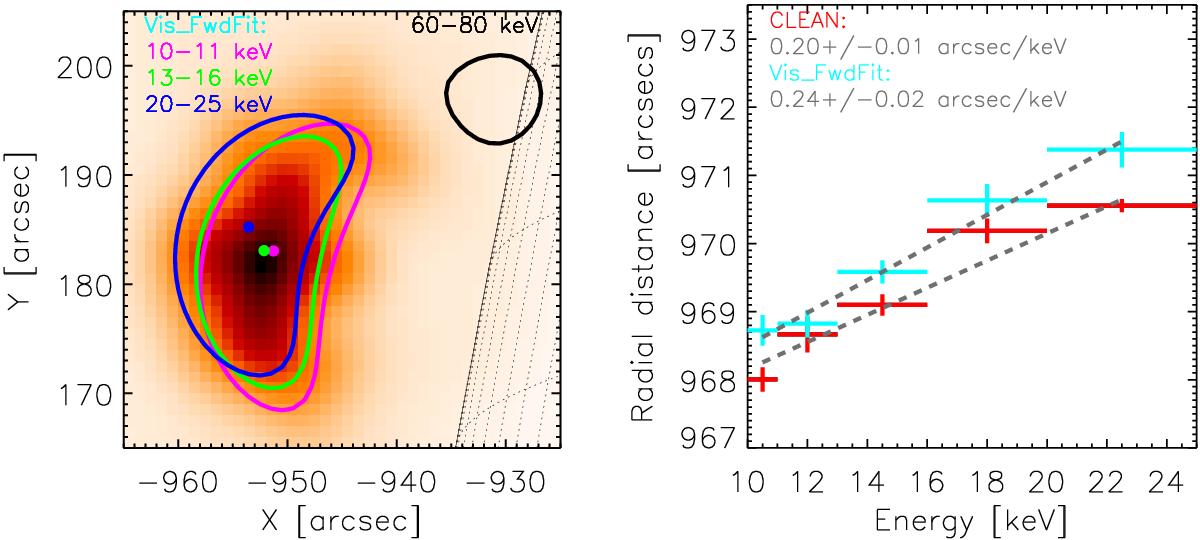
Left: CLEAN image for a time interval from 02:08 to 02:10 UT at 13–16 keV with a CLEAN 60–80 keV 50% contour (black). Vis_FwdFit contours at 50% of the maximum and coronal source positions (coloured dots) are displayed for three energy ranges (10–11 keV (pink), 13–16 keV (green) and 20–25 keV (blue)) showing the increasing altitude of the coronal source location with energy. Right: the peak radial position R plotted against X-ray energy ϵ, for both the CLEAN (red) and Vis_FwdFit (blue) algorithms. The gradient α = dR/ dϵ ± error found from each linear fit is shown (grey dashed lines) on the graph.
Current usage metrics show cumulative count of Article Views (full-text article views including HTML views, PDF and ePub downloads, according to the available data) and Abstracts Views on Vision4Press platform.
Data correspond to usage on the plateform after 2015. The current usage metrics is available 48-96 hours after online publication and is updated daily on week days.
Initial download of the metrics may take a while.