Fig. 7
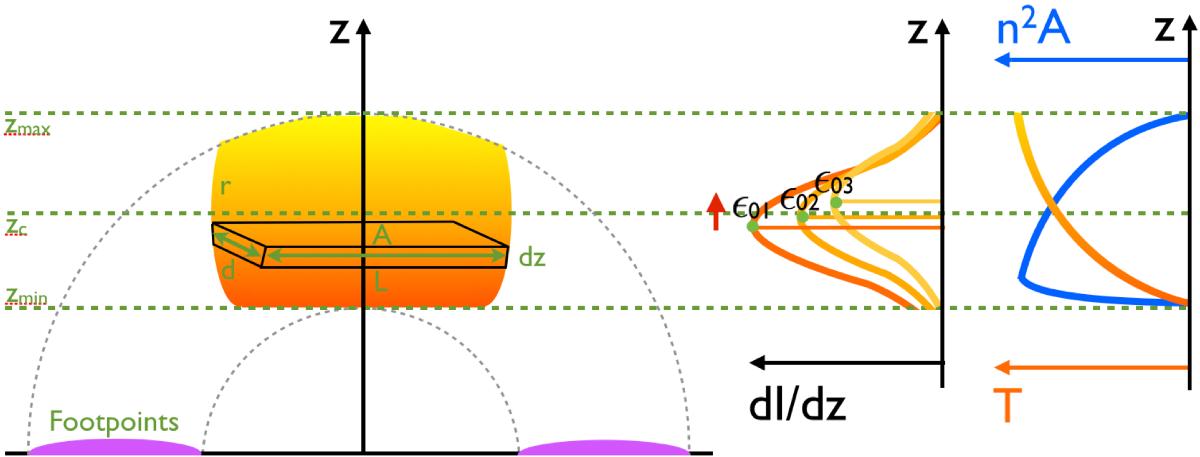
Left: sketch of the coronal X-ray source geometry, as seen by RHESSI. The lower temperature plasma is located below the higher temperature plasma. A small volume of emitting plasma dV = A dz = Ld dz varies with altitude z. Right: cartoon of the X-ray distribution versus z at energies ϵ01<ϵ02<ϵ03 created by varying temperature T and n2A distributions with altitude z. The peak X-ray positions at a given energy, as viewed by RHESSI, are related to a T and n2A value at that position.
Current usage metrics show cumulative count of Article Views (full-text article views including HTML views, PDF and ePub downloads, according to the available data) and Abstracts Views on Vision4Press platform.
Data correspond to usage on the plateform after 2015. The current usage metrics is available 48-96 hours after online publication and is updated daily on week days.
Initial download of the metrics may take a while.