Fig. 8
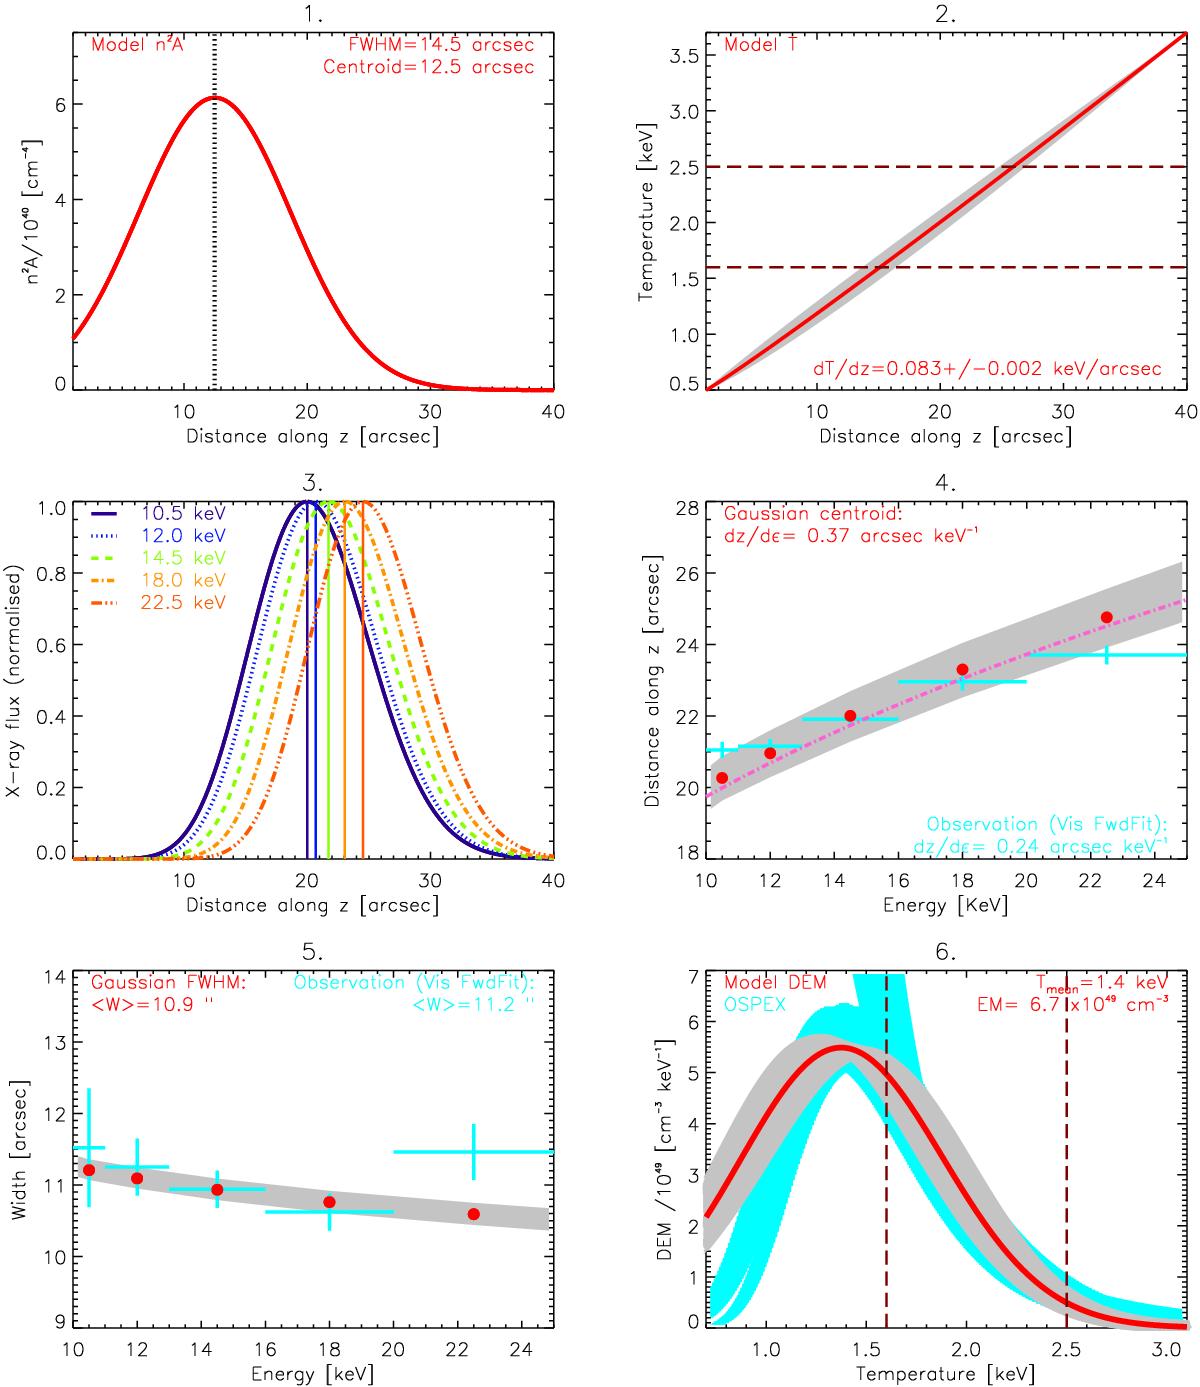
Temperature and density-altitude distribution model (see Sect. 5 for details) with 6 different panels. In all panels, the best model result is represented by the red line and points. 1: n2A vs. height z given by Eq. (14). 2: Temperature T vs. z given by Eq. (15). 3: X-ray distribution at various photon energies ϵ vs. altitude. The vertical lines indicate the peak locations. 4: The model X-ray distribution peak position vs. energy (red dots) and Eq. (9) using the model T(z) and n2(z)A(z) (pink dashed-dotted line). 5: X-ray distribution widths (FWHM) vs. energy. 6: Differential emission measure, DEM(T). Panels 4–6 show both the results of the RHESSI data analysis (in blue) and the model predictions (in red). The grey areas show the range of each parameter that can adequately match the measured values using the range of modelled T(z) shown in Panel 2.
Current usage metrics show cumulative count of Article Views (full-text article views including HTML views, PDF and ePub downloads, according to the available data) and Abstracts Views on Vision4Press platform.
Data correspond to usage on the plateform after 2015. The current usage metrics is available 48-96 hours after online publication and is updated daily on week days.
Initial download of the metrics may take a while.