Fig. 9
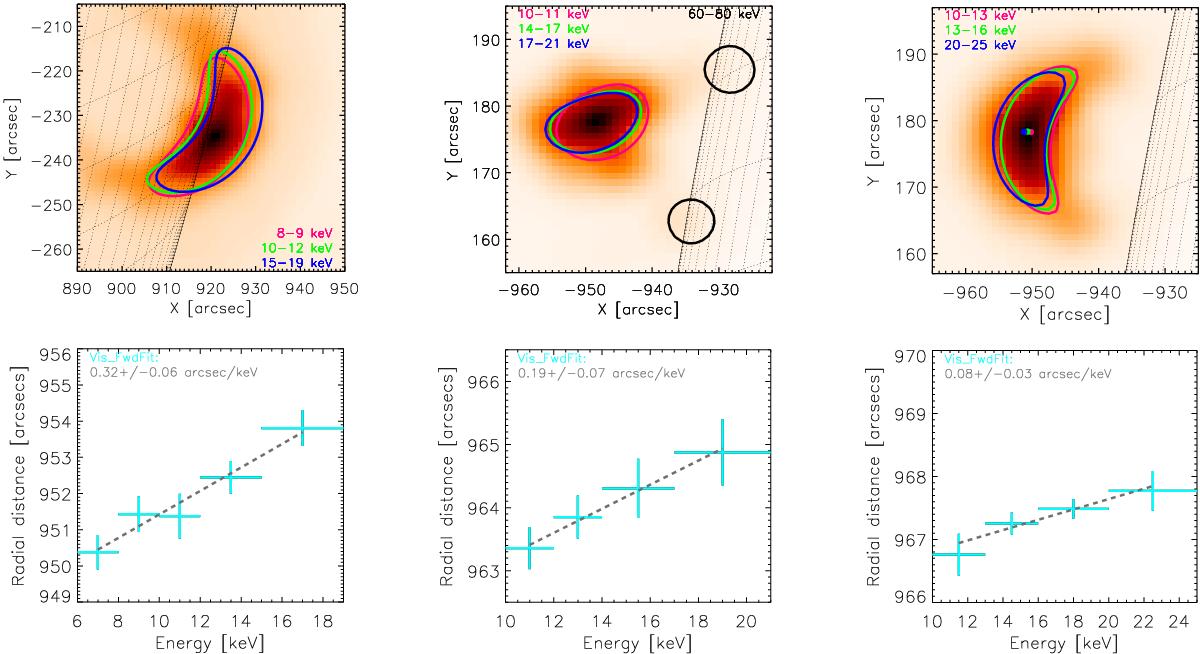
Coronal X-ray sources in different energy bands, for two additional flares: SOL2005-08-23T14:32 from 14:30 to 14:33 UT (left) and SOL2013-05-13T16:05 from 16:02 to 16:04 UT (middle). Both flares are imaged during the time of peak X-ray flux, and the source altitude increases with X-ray photon energy in these two flares. This trend also occurs for the analysed flare SOL2013-05-13T02:12 at different times (right). Here the imaging results are shown for the time of 02:04 to 02:06 UT during the rise phase of the flare, showing that the gradient dR/ dϵ varies with time.
Current usage metrics show cumulative count of Article Views (full-text article views including HTML views, PDF and ePub downloads, according to the available data) and Abstracts Views on Vision4Press platform.
Data correspond to usage on the plateform after 2015. The current usage metrics is available 48-96 hours after online publication and is updated daily on week days.
Initial download of the metrics may take a while.