Fig. 2
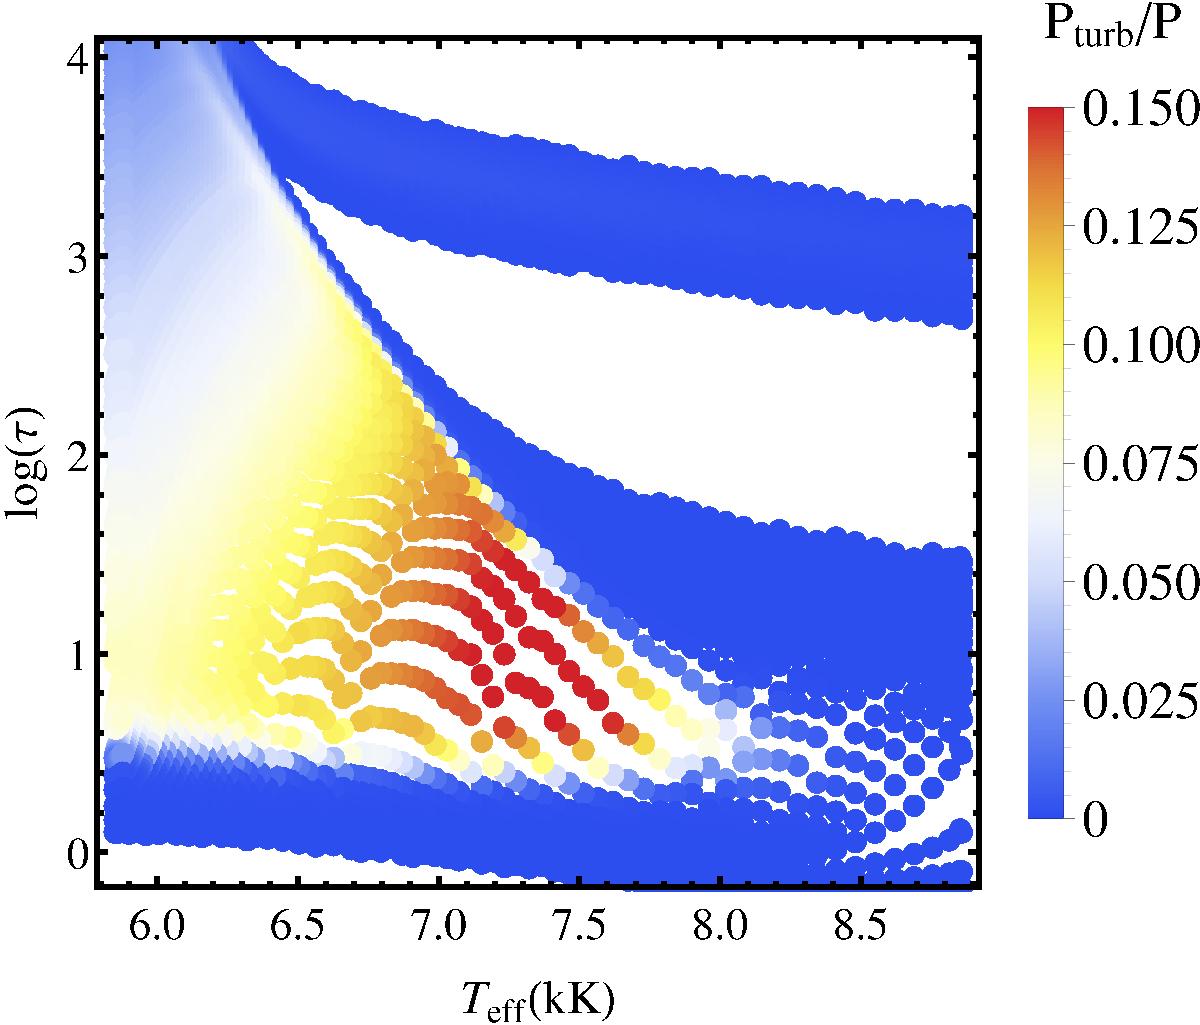
Ratio of turbulent-to-total pressure (color coded) as a function of the effective temperature and the optical depth throughout part of the evolution of a 1.9 M⊙ model. Extended white areas are radiatively stable. The HeCZ is visible in the top right section of the plot. For Teff> 7700 K the HCZ is present from the surface up to log (τ) ≈ 2. At lower Teff the outer boundary of the HCZ is located at log (τ) ≈ 0, while the inner boundary reaches log (τ) > 3.5 and merges with the HeCZ.
Current usage metrics show cumulative count of Article Views (full-text article views including HTML views, PDF and ePub downloads, according to the available data) and Abstracts Views on Vision4Press platform.
Data correspond to usage on the plateform after 2015. The current usage metrics is available 48-96 hours after online publication and is updated daily on week days.
Initial download of the metrics may take a while.