Fig. 4
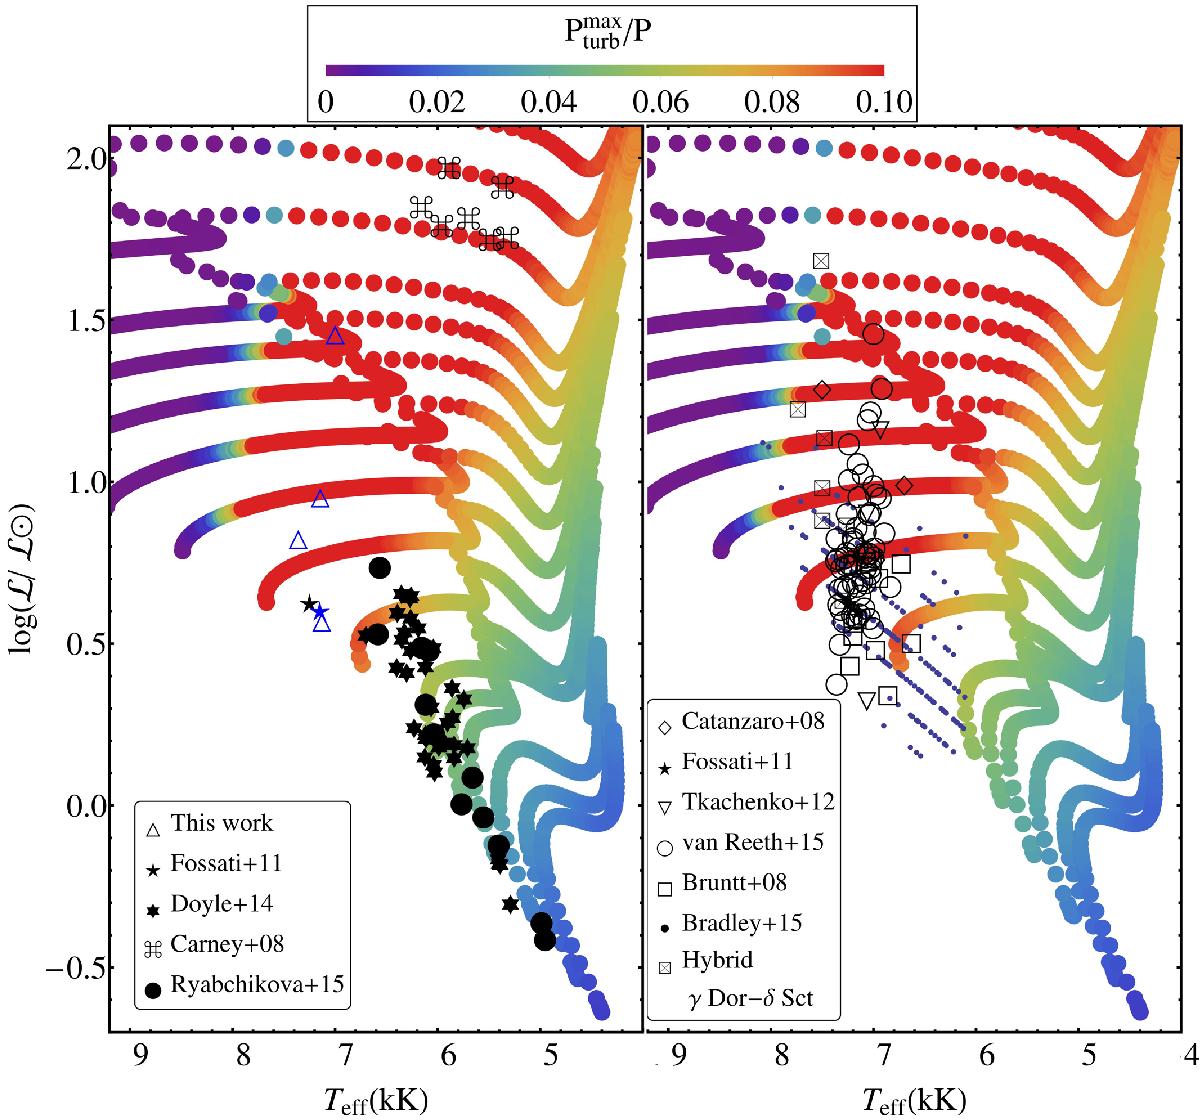
Left: stellar evolutionary tracks in a sHR diagram color coded according to the maximum fraction of Pturb/P (see top bar). Overplotted are the location of 56 stars analyzed by Carney et al. (2008), Fossati et al. (2011), Doyle et al. (2014), and Ryabchikova et al. (2015) for which macroturbulent velocities are available, in addition to those listed in Table A.1. The five stars color coded in blue are bona fide γ Dor pulsators. Right: as in left panel, with overplotted the location of ≈300 γ Dor stars analyzed by Bruntt et al. (2008), Catanzaro et al. (2011), Fossati et al. (2011), Tkachenko et al. (2012), Bradley et al. (2015), and Van Reeth et al. (2015) and some hybrid γ Dor–δ Sct stars from Catanzaro et al. (2011) and Tkachenko et al. (2012).
Current usage metrics show cumulative count of Article Views (full-text article views including HTML views, PDF and ePub downloads, according to the available data) and Abstracts Views on Vision4Press platform.
Data correspond to usage on the plateform after 2015. The current usage metrics is available 48-96 hours after online publication and is updated daily on week days.
Initial download of the metrics may take a while.