Fig. B.1
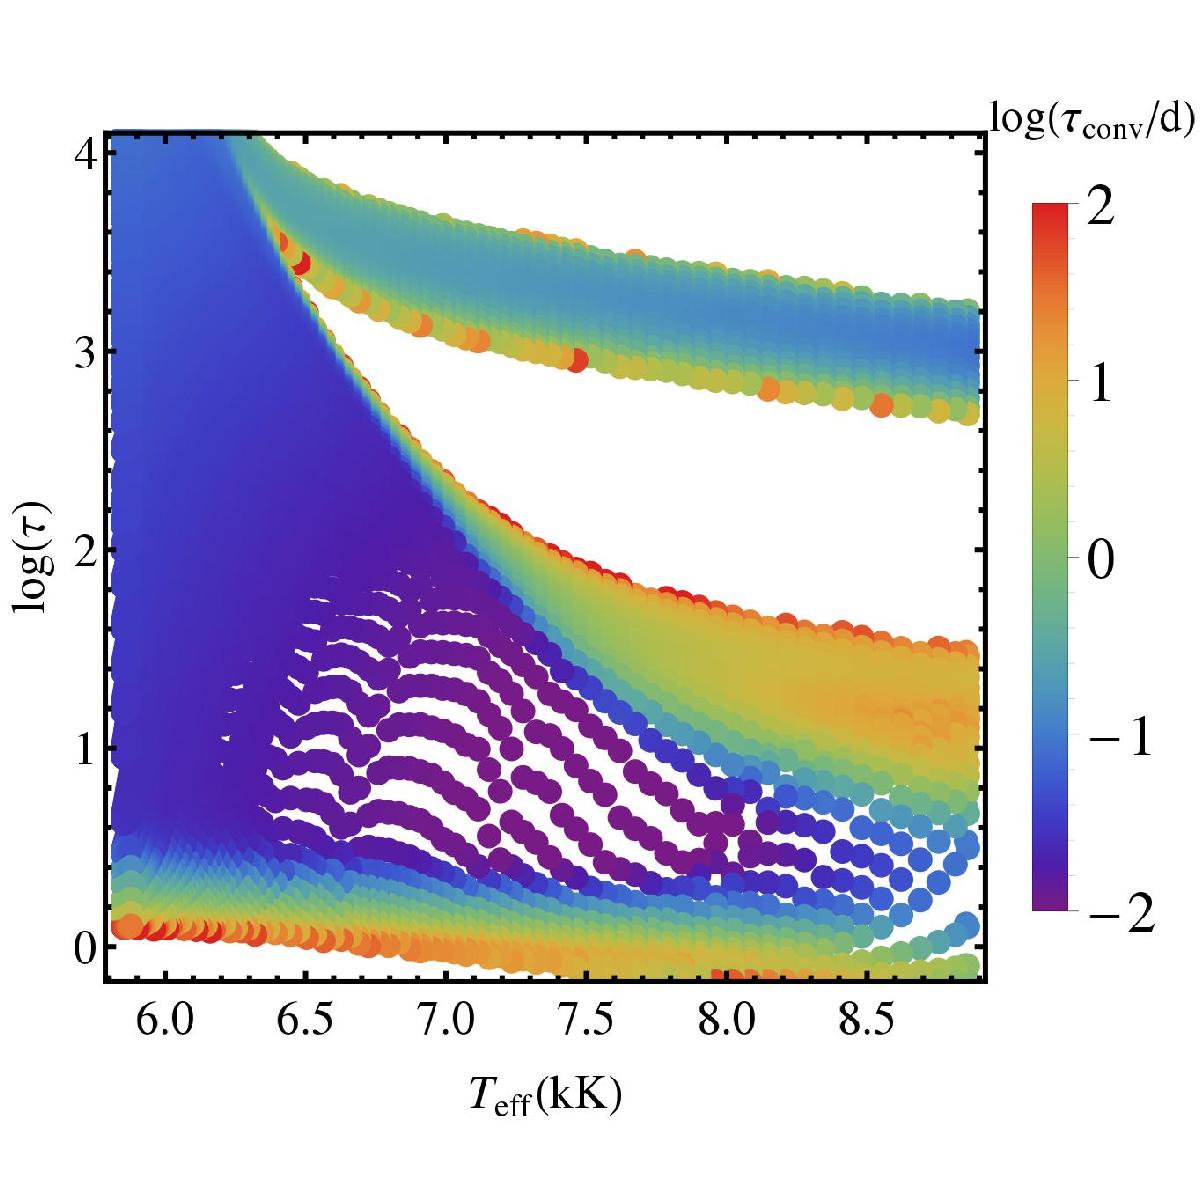
Convective timescale (color coded) as a function of the effective temperature and optical depth throughout part of the evolution of a 1.9 M⊙ model (same as Fig. 2). In the center of the hydrogen convective zone, where we find the higher contribution from Pturb, the convective timescales are ≈ 10-2 days, while at the edges of the hydrogen convective zone τconv increases up to ≈ 101−102 days.
Current usage metrics show cumulative count of Article Views (full-text article views including HTML views, PDF and ePub downloads, according to the available data) and Abstracts Views on Vision4Press platform.
Data correspond to usage on the plateform after 2015. The current usage metrics is available 48-96 hours after online publication and is updated daily on week days.
Initial download of the metrics may take a while.