Free Access
Fig. 8
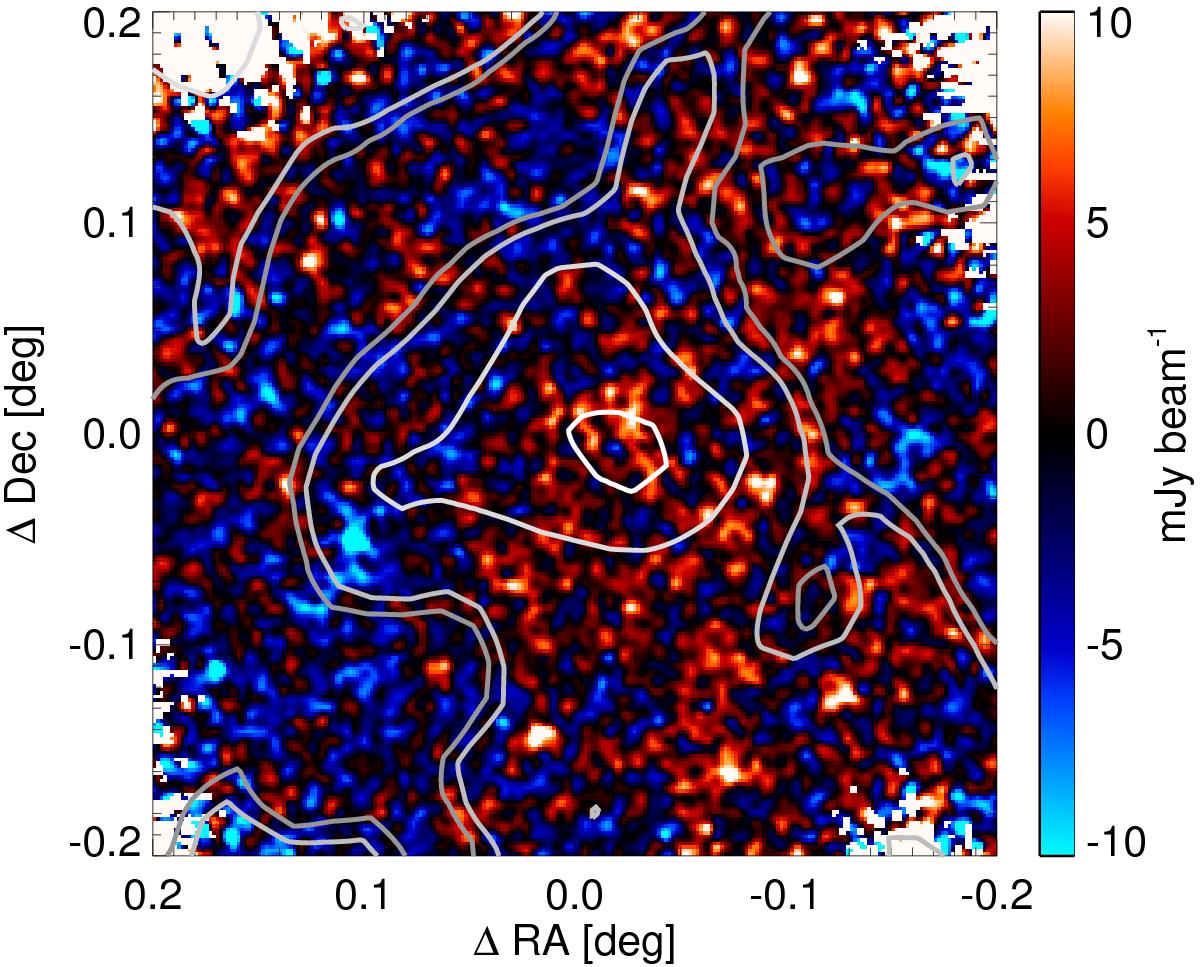
SPIRE “red excess” map (MRX) at 500 μm. The contours of the cleaned Planck map at 550 μm are overlaid as grey lines at four levels: 0, 10, 50, and 90% of the local maximum.
Current usage metrics show cumulative count of Article Views (full-text article views including HTML views, PDF and ePub downloads, according to the available data) and Abstracts Views on Vision4Press platform.
Data correspond to usage on the plateform after 2015. The current usage metrics is available 48-96 hours after online publication and is updated daily on week days.
Initial download of the metrics may take a while.