Fig. A.1
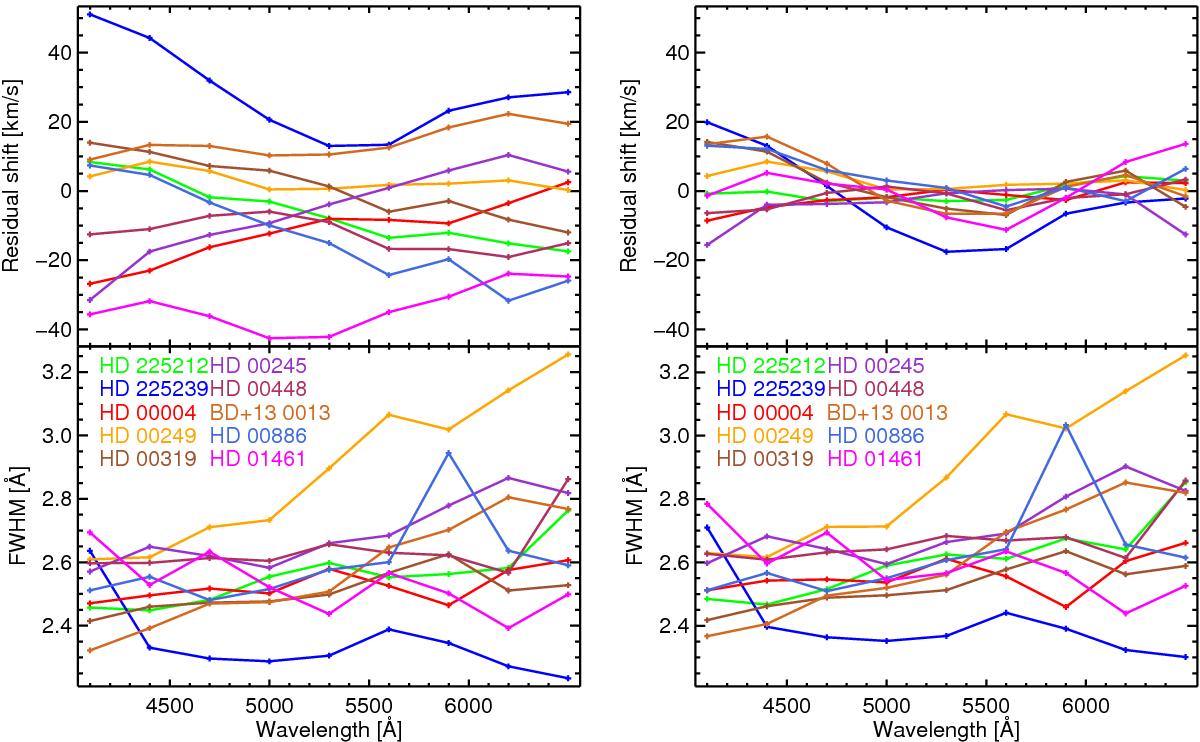
Line spread function of some MILES spectra. The first ten stars of the library are represented with different colours, as labelled. The left panels are for MILES v9.0 (the first release) and the right panels for MILES v9.1 (the updated version). The top panels show the velocity shift, i.e. wavelength calibration error, as a function of the wavelength, and the bottom panels present the FWHM resolution.
Current usage metrics show cumulative count of Article Views (full-text article views including HTML views, PDF and ePub downloads, according to the available data) and Abstracts Views on Vision4Press platform.
Data correspond to usage on the plateform after 2015. The current usage metrics is available 48-96 hours after online publication and is updated daily on week days.
Initial download of the metrics may take a while.