Fig. 7
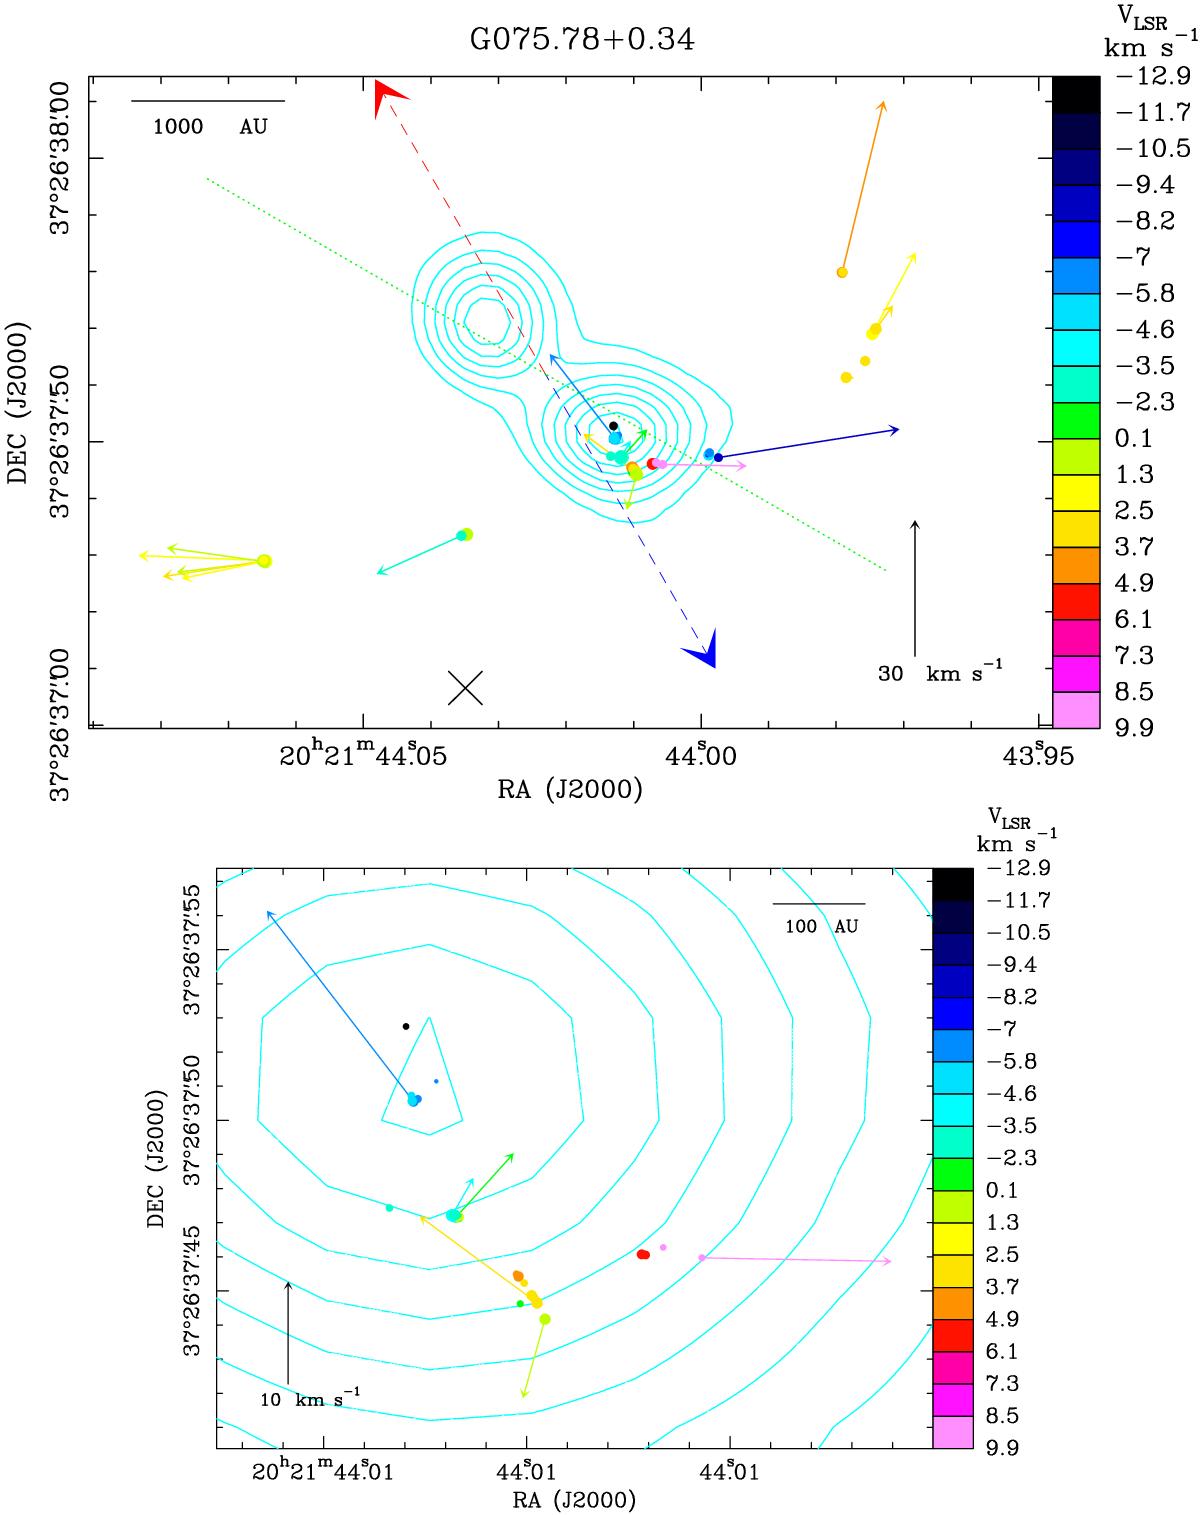
Top panel: cyan contours: JVLA A-Array Ku-band continuum with plotted levels −10% and from 10% to 90%, in steps of 10%, of the peak value of 1.0 mJy beam-1. This source was not detected in our JVLA A-Array C-band observations, yelding a 5σ upper limit of ~70 μJy. This source was not observed in the K-band by the JVLA. Colored dots and arrows have the same meaning as in Fig. 1. The amplitude scale for the maser velocity is indicated by the black arrow in the bottom right of the panel. The black cross gives the (velocity-averaged) position of the 6.7 GHz methanol masers, detected at low velocity resolution in the C-band. The red and blue arrows indicate the direction of the red- and blueshifted lobes, respectively, of the bipolar collimated outflow observed in the 12CO(2–1) line by Sánchez-Monge (2011). The green dotted line gives the orientation of the elongated (Spitzer GLIMPSE 4.5 μm) “green fuzzy emission” detected in this region. Bottom panel: enlargement of the clustered water maser emission close to the Ku-band continuum peak. The cyan contours and the overlaid colored dots and arrows have the same meaning as in the top panel. The amplitude scale for the maser velocity is indicated by the black arrow in the bottom left of the panel.
Current usage metrics show cumulative count of Article Views (full-text article views including HTML views, PDF and ePub downloads, according to the available data) and Abstracts Views on Vision4Press platform.
Data correspond to usage on the plateform after 2015. The current usage metrics is available 48-96 hours after online publication and is updated daily on week days.
Initial download of the metrics may take a while.