Fig. 6
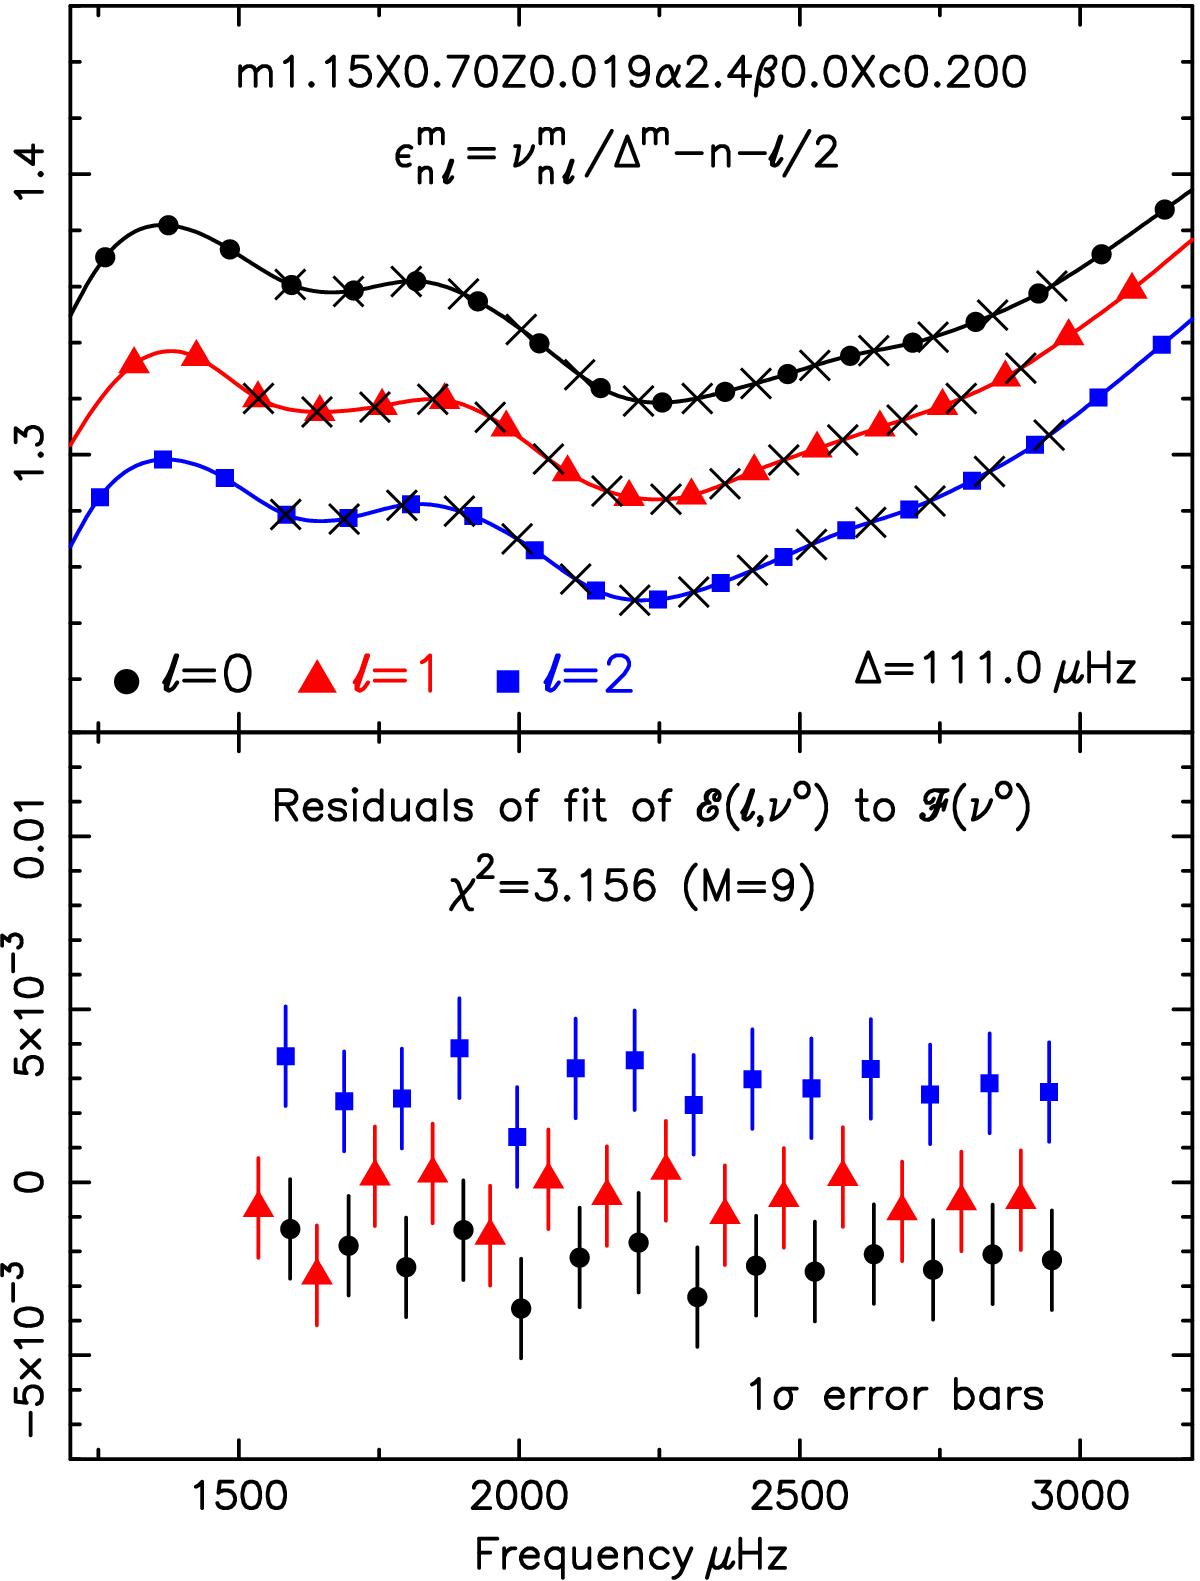
Top panel: ϵnℓ values of the model C, the continuous curves ϵℓ(ν) obtained by interpolation, and the values at the frequencies νo of Model A (the crosses). Bottom panel: residuals of fit of ![]() to a function of frequency ℱ(ν). The χ2 of the fit is 3.16, demonstrating that this model does not have the same interior structure as model A.
to a function of frequency ℱ(ν). The χ2 of the fit is 3.16, demonstrating that this model does not have the same interior structure as model A.
Current usage metrics show cumulative count of Article Views (full-text article views including HTML views, PDF and ePub downloads, according to the available data) and Abstracts Views on Vision4Press platform.
Data correspond to usage on the plateform after 2015. The current usage metrics is available 48-96 hours after online publication and is updated daily on week days.
Initial download of the metrics may take a while.