Fig. 3
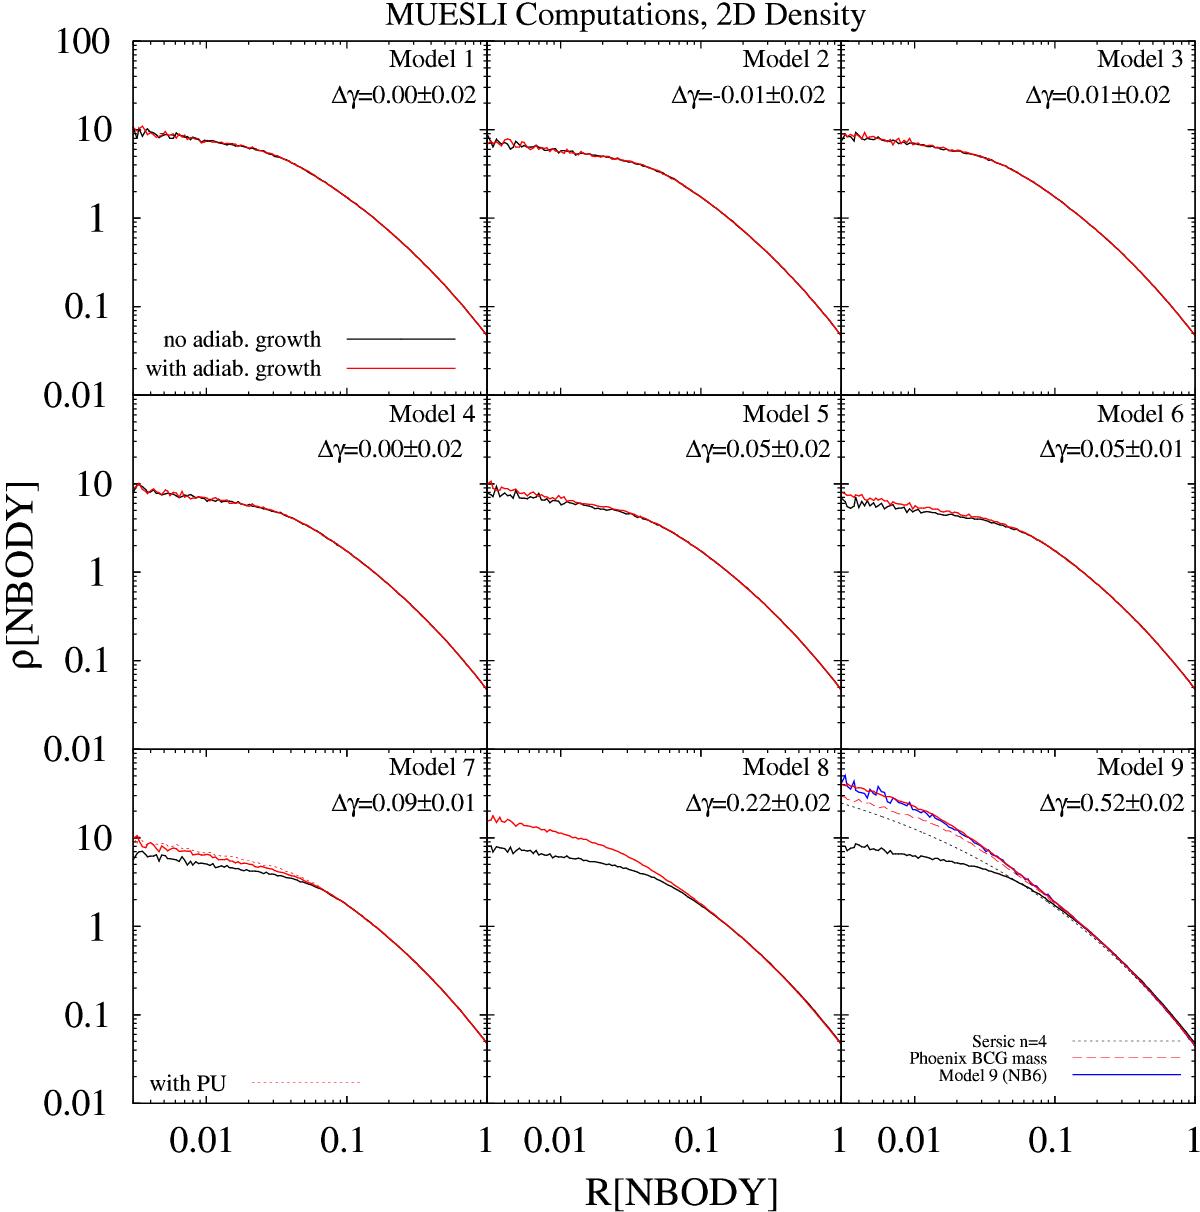
Projected (2D) density profiles of all nine models. Red lines represent adiabatic SMBH growth models after T = 8 Gyr (Models 1–8) and T = 6.7 Gyr (Model 9), whereas black lines show reference models without growing SMBHs (i.e., ΔM• = 0). The density slopes, γ, are fitted within half the size of the initial break radii by using a simple power-law approximation. Hence, they are influenced by the outer profile and we quote them with their sign. In ascending order of the computed reference Models 1–9 these are: γref = −0.26; −0.26; −0.3; −0.3; −0.28; −0.23; −0.25; −0.3; −0.3. The quantity Δγ = γref − γadiab ≥ 0 results from a growing density cusp due to adiabatic SMBH growth. Evidently, accretion rates with ![]() lead to a cusp regeneration process. Smaller accretion rates (Models 1–5) have no strong impact on the innermost 2D density slope. In panel 9 a pure Sersic n = 4 model is added for comparison (black dotted line). The solid blue line corresponds to the nbody6 computation of the same model. It is in excellent agreement with the solid red line. The red dashed line is similar, but is scaled to a 1.5 times larger host galaxy mass, similar to the Phoenix BCG (McDonald et al. 2013).
lead to a cusp regeneration process. Smaller accretion rates (Models 1–5) have no strong impact on the innermost 2D density slope. In panel 9 a pure Sersic n = 4 model is added for comparison (black dotted line). The solid blue line corresponds to the nbody6 computation of the same model. It is in excellent agreement with the solid red line. The red dashed line is similar, but is scaled to a 1.5 times larger host galaxy mass, similar to the Phoenix BCG (McDonald et al. 2013).
Current usage metrics show cumulative count of Article Views (full-text article views including HTML views, PDF and ePub downloads, according to the available data) and Abstracts Views on Vision4Press platform.
Data correspond to usage on the plateform after 2015. The current usage metrics is available 48-96 hours after online publication and is updated daily on week days.
Initial download of the metrics may take a while.