Fig. A.3
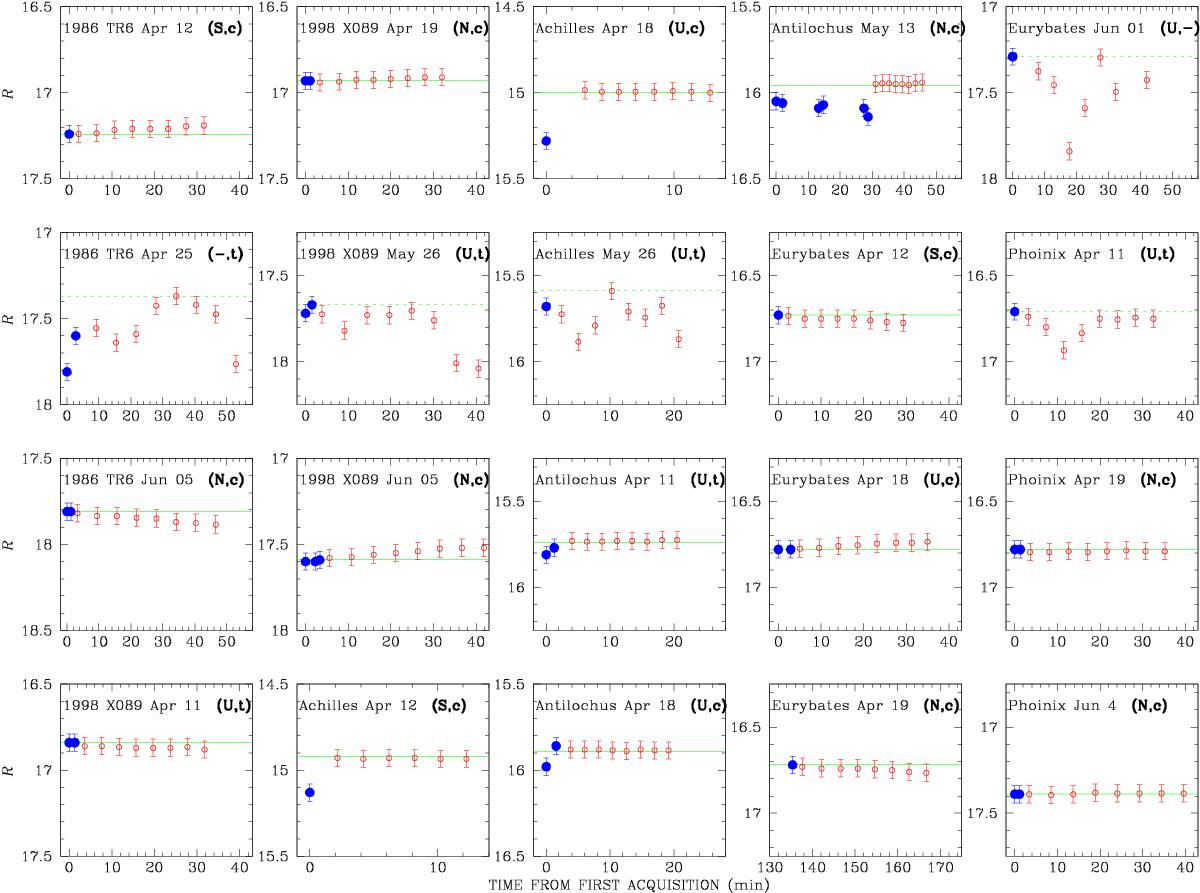
Photometric measurements. The blue solid circles represent the photometry measured in the acquisition images, and the red empty circles represent the photometry measured from the polarimetric images. The green lines show the final value adopted for the time series (dotted green line represent an upper limit). In each panel, between parenthesis we report the ESO QC1 classification of the night (U = unknown, N = non stable, S = stable) followed by the sky conditions as we estimate after inspection of the LOSSAM plots available (c = clear, t = thin to thick). The LOSSAM archive is available online through the ESO website. This figure is discussed in Sect. 2.3.
Current usage metrics show cumulative count of Article Views (full-text article views including HTML views, PDF and ePub downloads, according to the available data) and Abstracts Views on Vision4Press platform.
Data correspond to usage on the plateform after 2015. The current usage metrics is available 48-96 hours after online publication and is updated daily on week days.
Initial download of the metrics may take a while.