Fig. 1
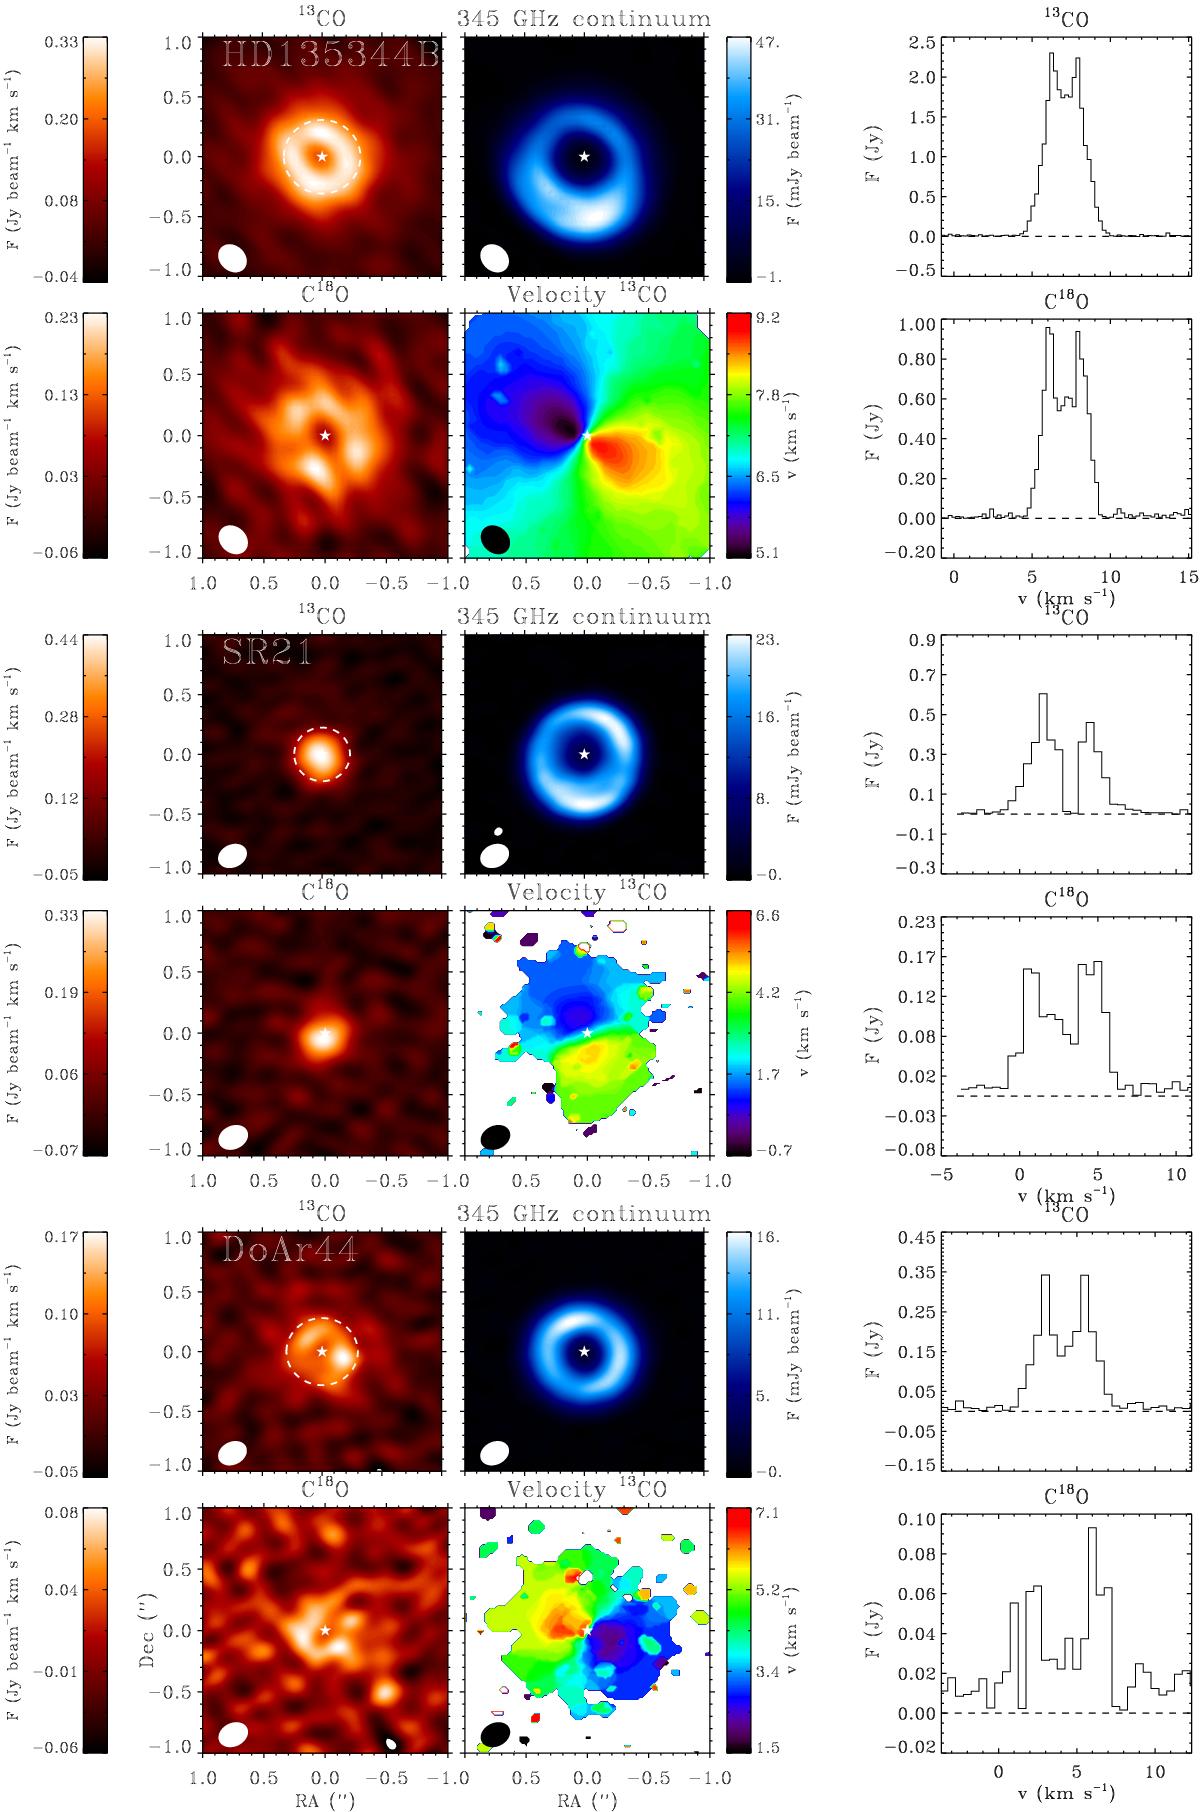
ALMA observations of the continuum, 13CO and C18O 3−2 lines of the first three targets. Top left: zero-moment 13CO map. Top middle: continuum map. Top right: 13CO spectrum integrated over the entire disk. Bottom left: zero-moment C18O map. Bottom middle: first moment 13CO map (velocity map). Bottom right: C18O spectrum integrated over the entire disk. The beam is indicated in each map by a white ellipse in the lower left corner. The dotted white ellipse indicates the dust cavity radius.
Current usage metrics show cumulative count of Article Views (full-text article views including HTML views, PDF and ePub downloads, according to the available data) and Abstracts Views on Vision4Press platform.
Data correspond to usage on the plateform after 2015. The current usage metrics is available 48-96 hours after online publication and is updated daily on week days.
Initial download of the metrics may take a while.