Fig. 6
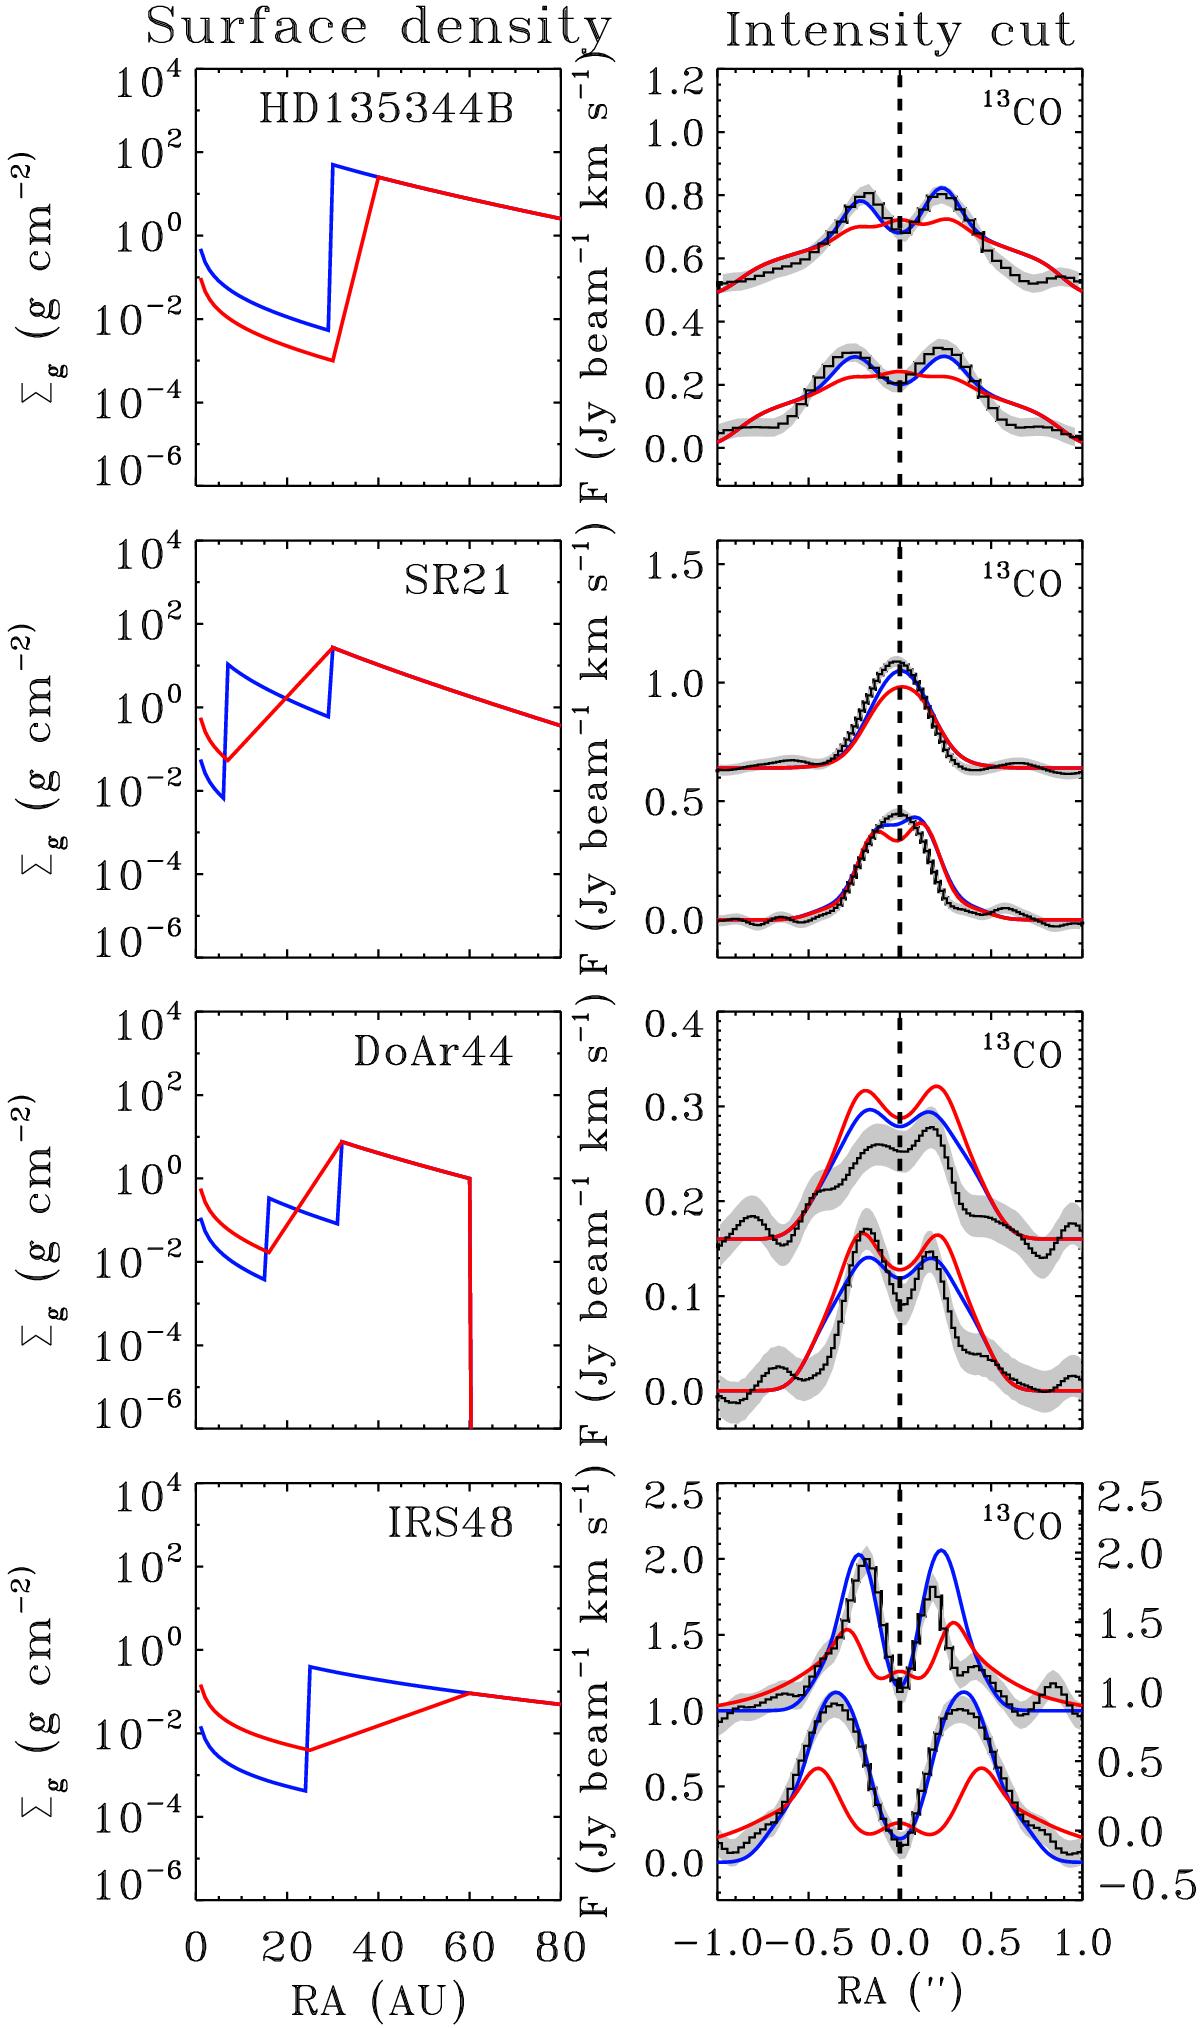
Comparison of the intensity cuts between the best-fit models (blue) and a gradual model (red) as defined in Eq. (2). The right panel gives the density profile. All disks except IRS 48 can be fit equally well with this gradual increase profile.
This figure is made of several images, please see below:
Current usage metrics show cumulative count of Article Views (full-text article views including HTML views, PDF and ePub downloads, according to the available data) and Abstracts Views on Vision4Press platform.
Data correspond to usage on the plateform after 2015. The current usage metrics is available 48-96 hours after online publication and is updated daily on week days.
Initial download of the metrics may take a while.