Free Access
Fig. 10
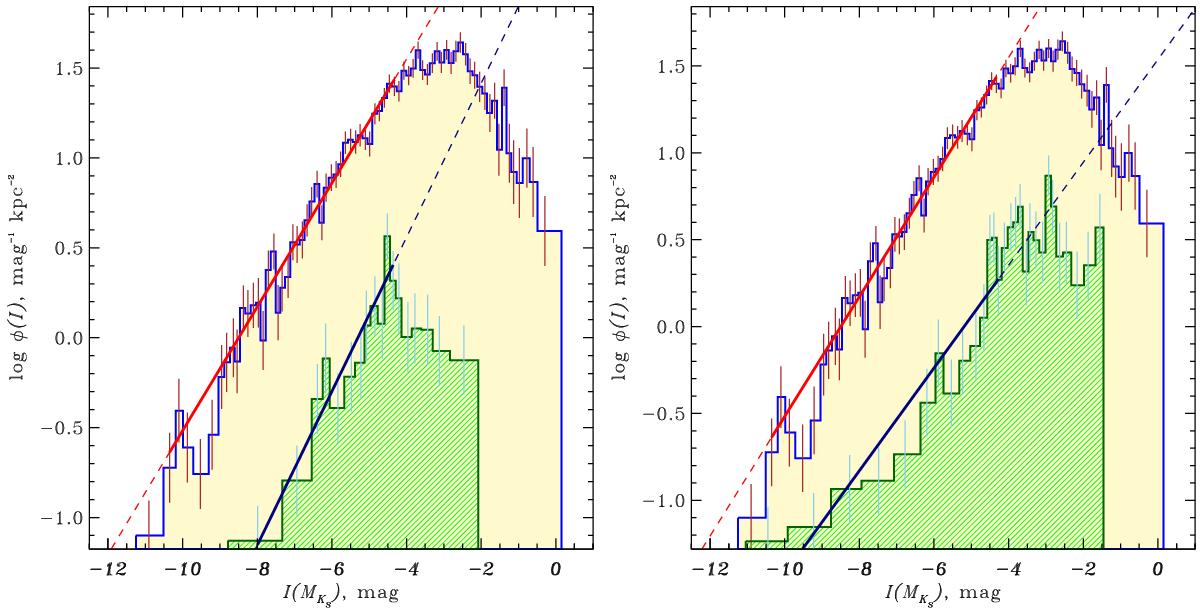
CLFs for young clusters in the KS passband. The yellow histograms show the general CLF. Green hatched histograms outline the CLFs for very young clusters (log t between 6.4 and 6.9) in the left panel, and for young clusters (log t from 7.2 to 7.7) in the right panel. The other designations are the same as in Fig. 7.
Current usage metrics show cumulative count of Article Views (full-text article views including HTML views, PDF and ePub downloads, according to the available data) and Abstracts Views on Vision4Press platform.
Data correspond to usage on the plateform after 2015. The current usage metrics is available 48-96 hours after online publication and is updated daily on week days.
Initial download of the metrics may take a while.