Fig. 5
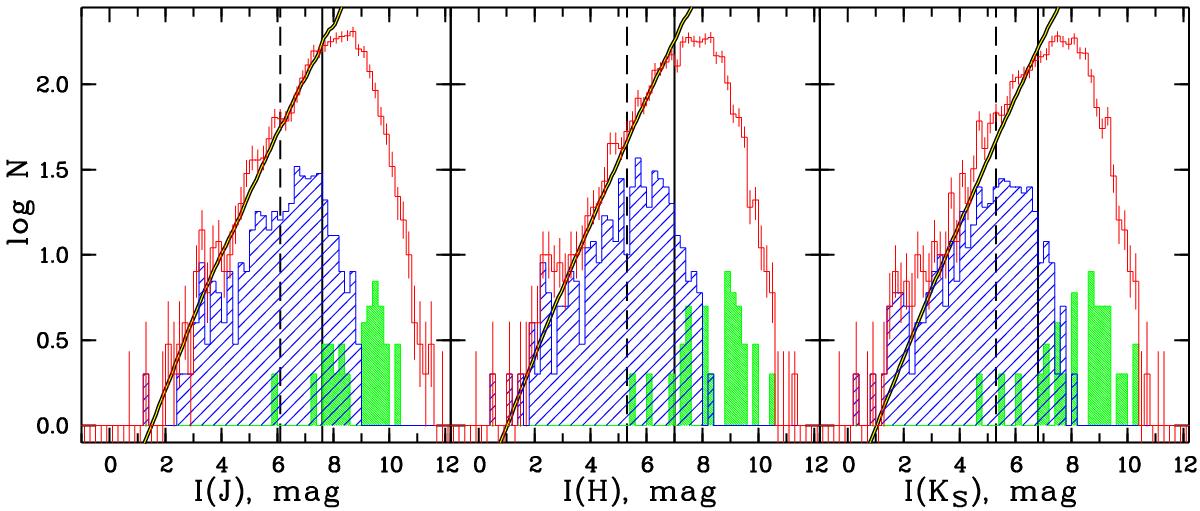
Distributions of apparent integrated magnitudes for the J,H,KS passbands of the MWSC survey. The open histograms correspond to the whole MWSC sample, the hatched histograms show the distributions of the absolutely brightest clusters (MKS< −6.75), whereas the filled histograms is for the distributions of the absolutely faintest clusters (MKS> −1.5). Bars indicate Poisson errors. Vertical solid lines indicate the adopted completeness magnitudes Î(P) of the MWSC sample. The vertical dashed lines mark the completeness magnitudes estimated for the COCD sample. The double black curve shows the modelled distribution of clusters.
Current usage metrics show cumulative count of Article Views (full-text article views including HTML views, PDF and ePub downloads, according to the available data) and Abstracts Views on Vision4Press platform.
Data correspond to usage on the plateform after 2015. The current usage metrics is available 48-96 hours after online publication and is updated daily on week days.
Initial download of the metrics may take a while.