Fig. 6
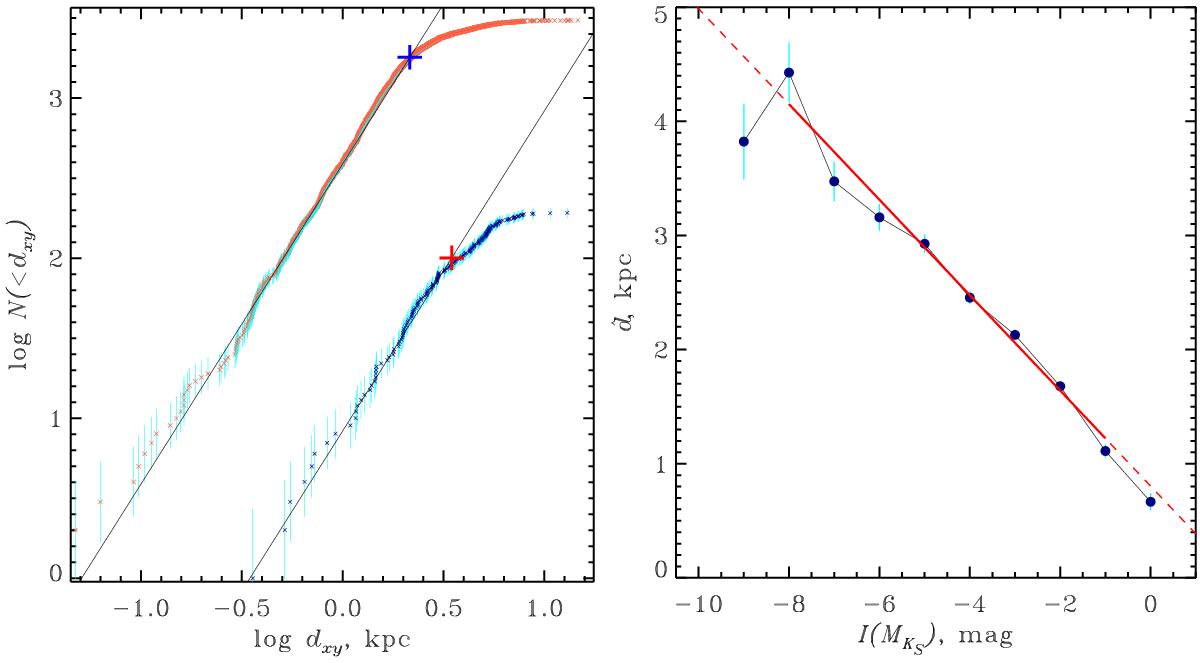
Cluster counts as a function of distance in the Galactic plane dxy from the Sun (left) and “absolute magnitude-completeness radius relation” (right). The counts for the whole MWSC survey are shown with small red crosses, and, as an example, counts for clusters within a magnitude bin of I(MKS) = −8–−7 are shown with small blue crosses. Cyan bars indicate statistical errors. The solid black lines correspond to the uniform surface density expressed by Eq. (3). The adopted completeness radii are labelled by large blue and red pluses. The right panel shows the completeness radii as a function of the absolute magnitude of clusters from the MWSC survey. The corresponding linear fit is indicated by a red line. The solid portion indicates where the fit is made, and the dashed segments extrapolate the fitted relation outside the fitting range.
Current usage metrics show cumulative count of Article Views (full-text article views including HTML views, PDF and ePub downloads, according to the available data) and Abstracts Views on Vision4Press platform.
Data correspond to usage on the plateform after 2015. The current usage metrics is available 48-96 hours after online publication and is updated daily on week days.
Initial download of the metrics may take a while.