Fig. 7
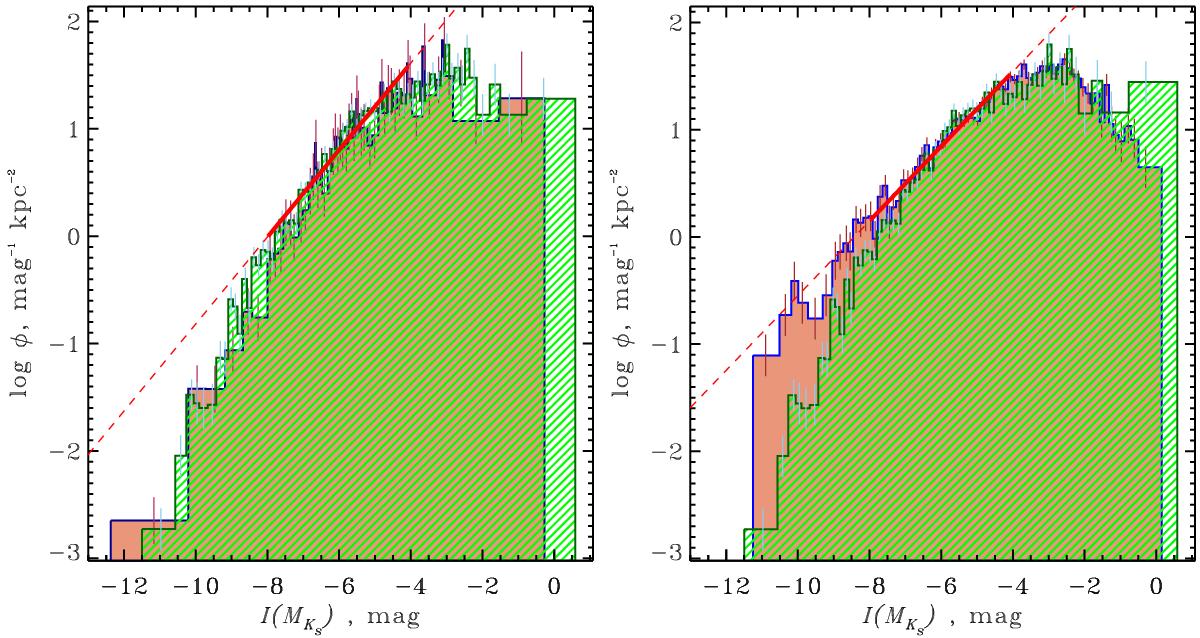
Comparison of cluster luminosity functions in the KS passband. built for different samples (MWSC and COCD) and different completeness approaches. Left panel: CLFs based on the magnitude-limited approach for the COCD cluster sample (red filled histogram) and for the MWSC cluster sample (green hatched histogram). Right panel: CLFs for the MWSC cluster sample based on two different techniques, the distance-limited approach (red filled histogram) and the magnitude-limited approach (green hatched histogram). The Poisson errors are shown with vertical bars. The thick lines mark linear fits of the MWSC CLFs in the magnitude range (I(MKS) = −8–−4). The extrapolation of the fits outside this magnitude range is shown by the dashed lines.
Current usage metrics show cumulative count of Article Views (full-text article views including HTML views, PDF and ePub downloads, according to the available data) and Abstracts Views on Vision4Press platform.
Data correspond to usage on the plateform after 2015. The current usage metrics is available 48-96 hours after online publication and is updated daily on week days.
Initial download of the metrics may take a while.