Free Access
Fig. 9
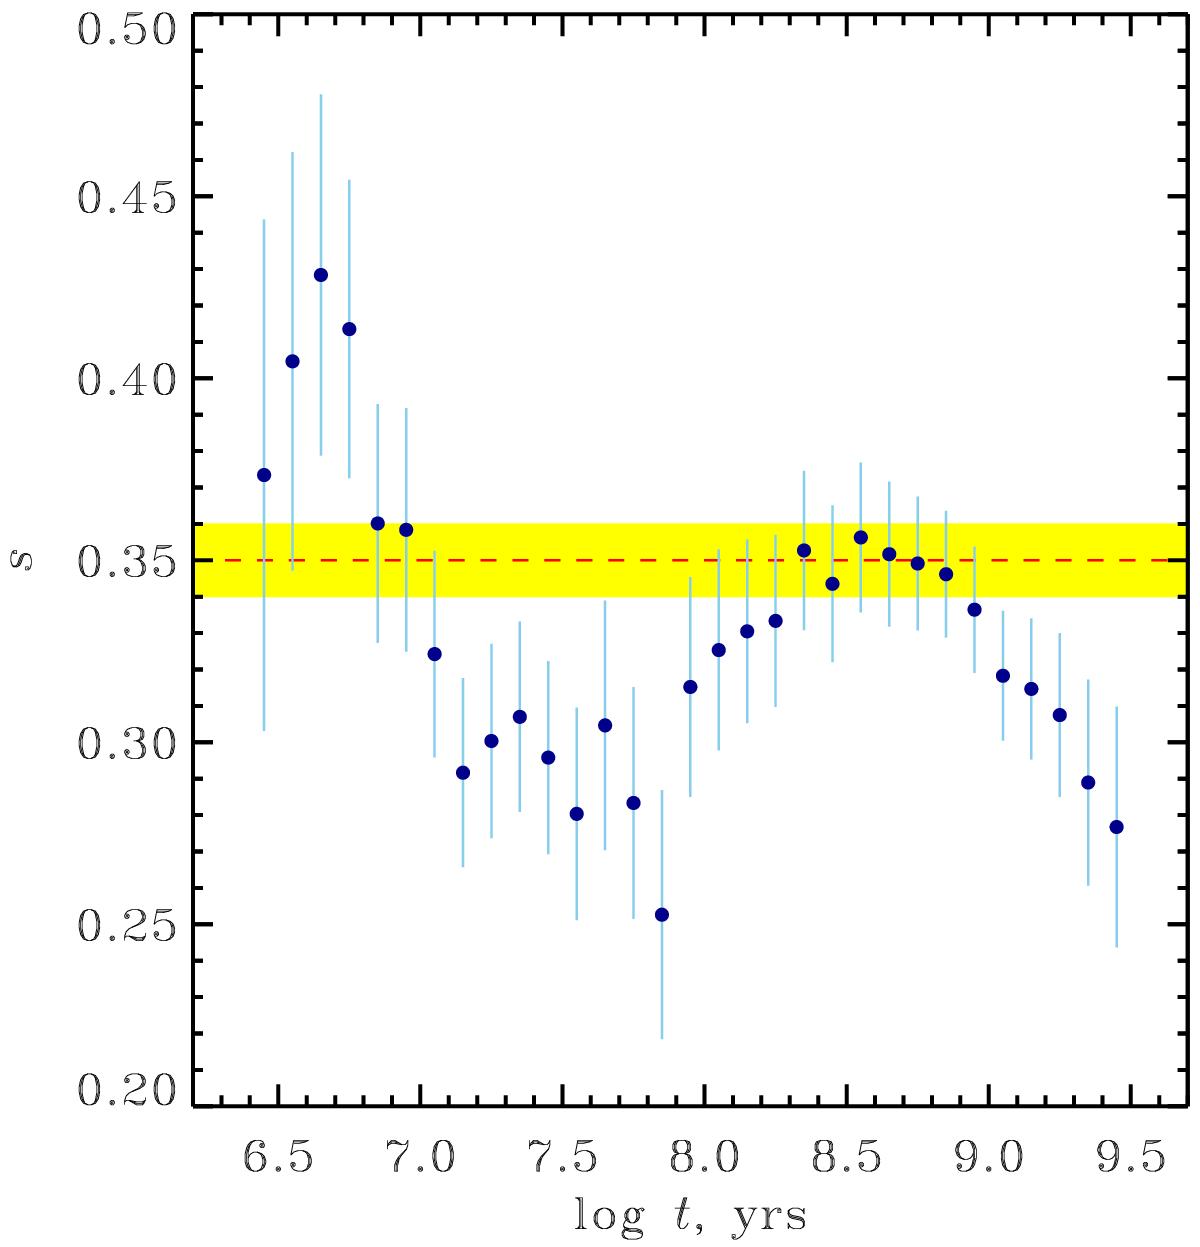
Slope s of the CLF for the KS passband versus cluster age. The rms errors of s are shown with vertical bars. The broken horizontal line indicates the slope of the general CLF, the filled strip its uncertainty.
Current usage metrics show cumulative count of Article Views (full-text article views including HTML views, PDF and ePub downloads, according to the available data) and Abstracts Views on Vision4Press platform.
Data correspond to usage on the plateform after 2015. The current usage metrics is available 48-96 hours after online publication and is updated daily on week days.
Initial download of the metrics may take a while.