Fig. 7
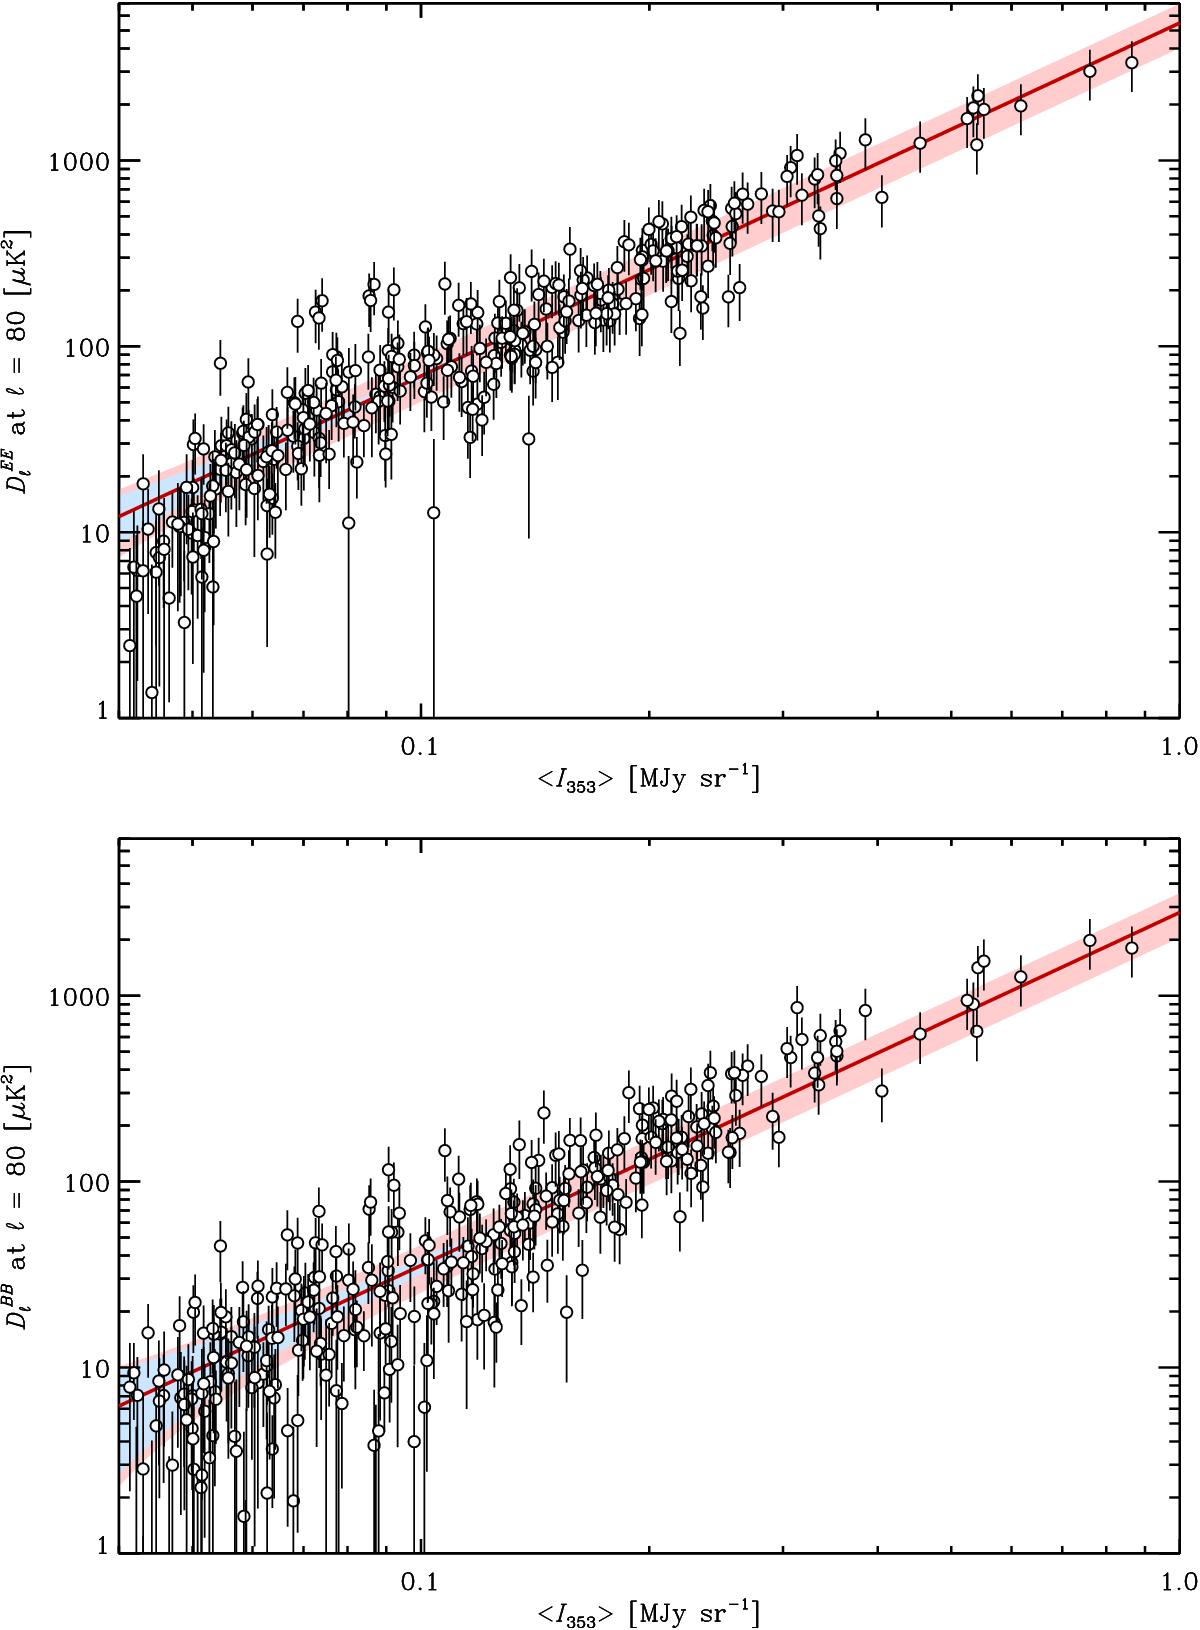
Fitted dust ![]() (top panel) and
(top panel) and
![]() (bottom panel)
amplitudes (AEE and
ABB) at
ℓ =
80, in μK2 for the 400 deg2 patches as a function of
their mean ⟨I353⟩. The empirical scaling law,
AEE,BB
∝⟨I353⟩1.9, adjusted in amplitude
to the data points, is overplotted as a red line. The ± 3σ statistical
error on this relation from Monte Carlo simulations of Planck
inhomogeneous noise (see Appendix C.1) is
represented as a light blue shaded area and the total ± 3σ error, including
statistical noise plus Gaussian sample variance, is represented as a light red
shaded area. Points are computed for all 352 patches, but we note that, as described
in Sect. 3.3.2, the patches overlap and so
their properties are not independent.
(bottom panel)
amplitudes (AEE and
ABB) at
ℓ =
80, in μK2 for the 400 deg2 patches as a function of
their mean ⟨I353⟩. The empirical scaling law,
AEE,BB
∝⟨I353⟩1.9, adjusted in amplitude
to the data points, is overplotted as a red line. The ± 3σ statistical
error on this relation from Monte Carlo simulations of Planck
inhomogeneous noise (see Appendix C.1) is
represented as a light blue shaded area and the total ± 3σ error, including
statistical noise plus Gaussian sample variance, is represented as a light red
shaded area. Points are computed for all 352 patches, but we note that, as described
in Sect. 3.3.2, the patches overlap and so
their properties are not independent.
Current usage metrics show cumulative count of Article Views (full-text article views including HTML views, PDF and ePub downloads, according to the available data) and Abstracts Views on Vision4Press platform.
Data correspond to usage on the plateform after 2015. The current usage metrics is available 48-96 hours after online publication and is updated daily on week days.
Initial download of the metrics may take a while.