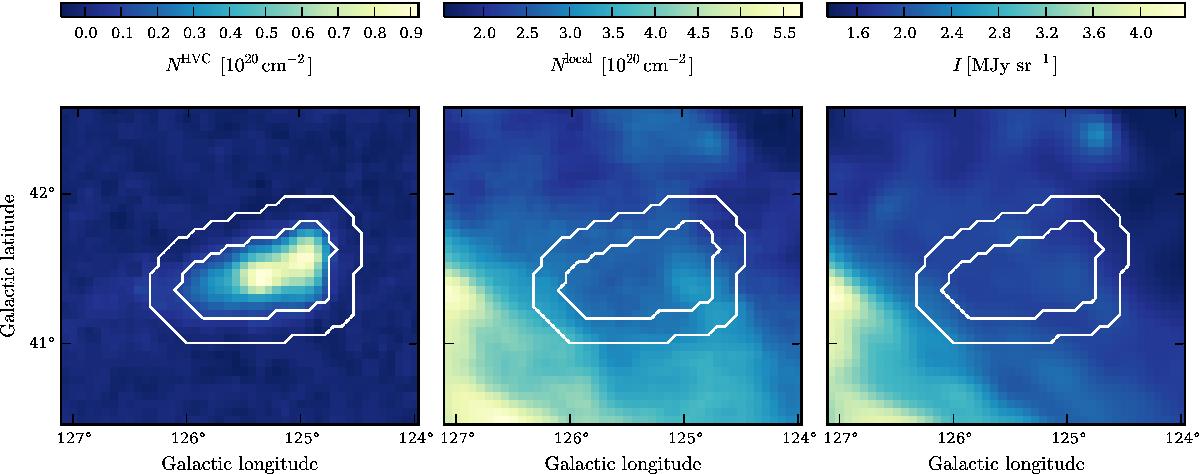
Fig. 1

Left: EBHIS column density map NHVC of the HVC (−230 km s-1<vLSR< −190 km s-1). Center: EBHIS column density map Nlocal of the local foreground emission (−190 km s-1<vLSR< + 30 km s-1). Right: FIR intensity I857 GHz from Planck Collaboration VIII (2016). The inner white contour line corresponds to the 5σ noise level in the HVC column density map. The outer contour marks an annulus that contains the same number of pixels as the tight HVC mask.
Current usage metrics show cumulative count of Article Views (full-text article views including HTML views, PDF and ePub downloads, according to the available data) and Abstracts Views on Vision4Press platform.
Data correspond to usage on the plateform after 2015. The current usage metrics is available 48-96 hours after online publication and is updated daily on week days.
Initial download of the metrics may take a while.


