Fig. 7
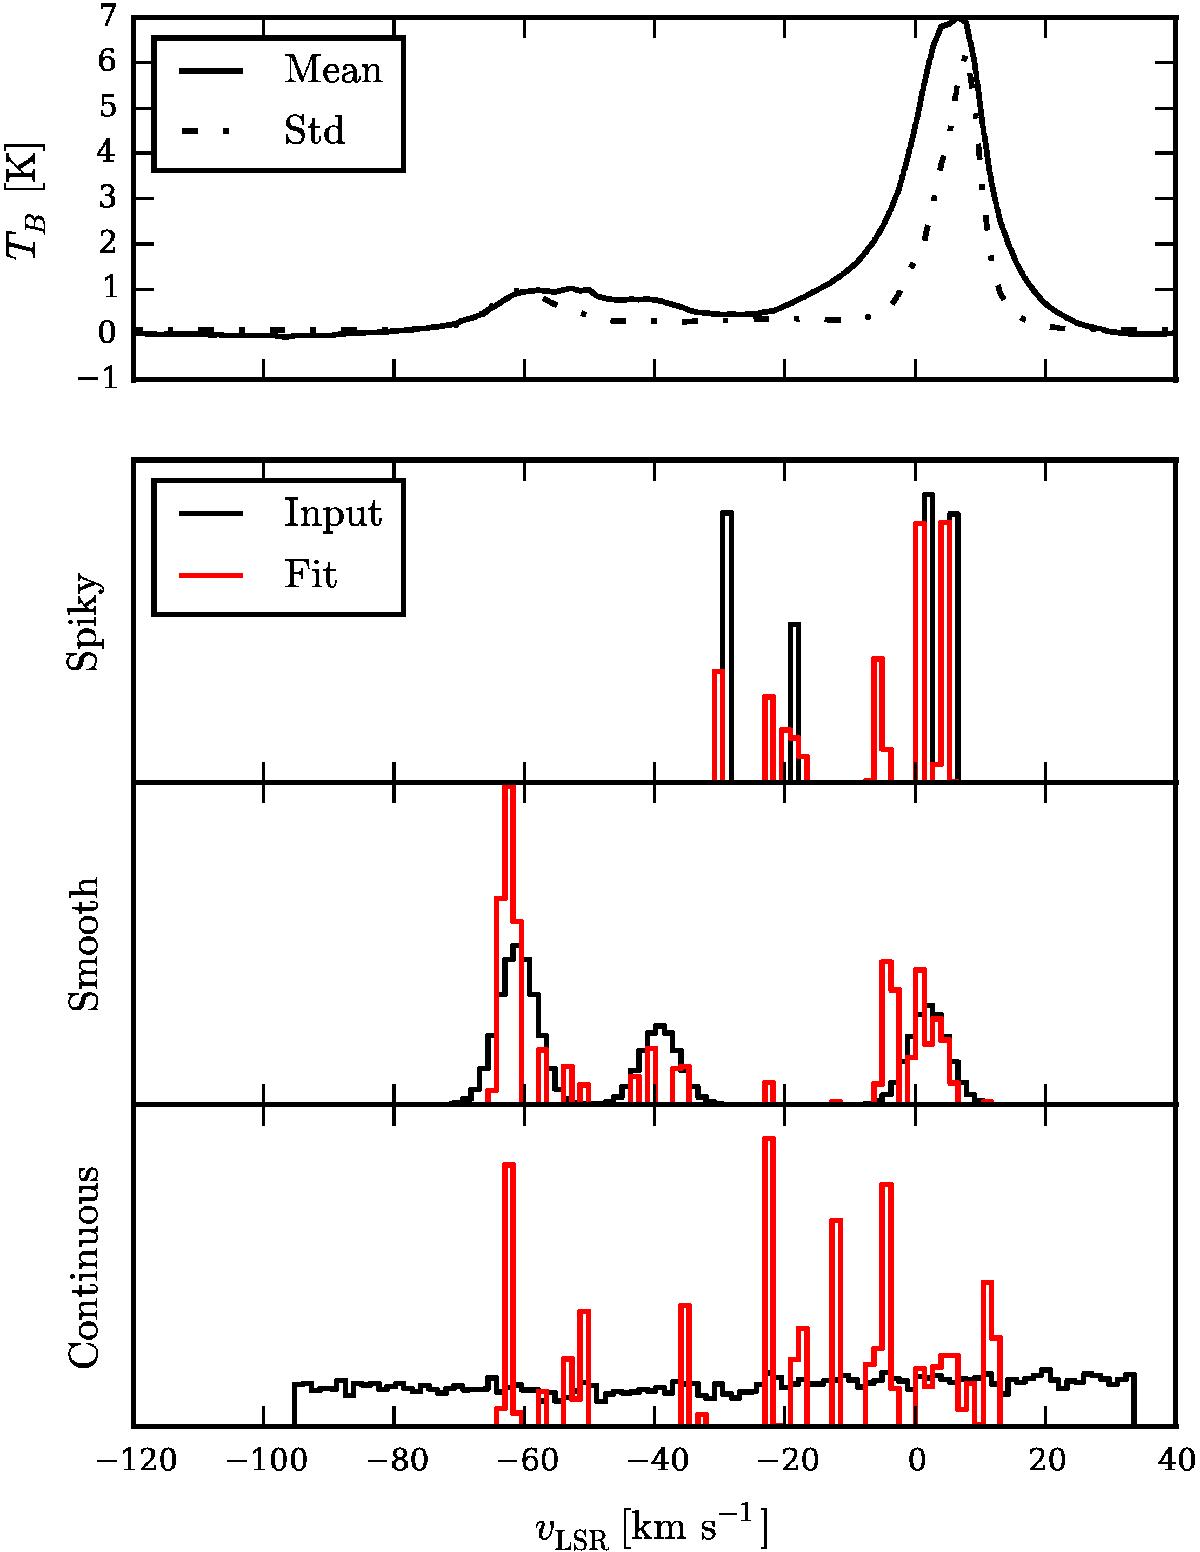
Top panel: spectrum of mean and standard deviation of the full H i data cube. Bottom panels: input spectra (black) of GLM coefficients to simulate FIR intensity maps. The reconstruction by the GLM is shown in red and has been shifted to the left by one channel for illustration purposes. See the text for a detailed description.
Current usage metrics show cumulative count of Article Views (full-text article views including HTML views, PDF and ePub downloads, according to the available data) and Abstracts Views on Vision4Press platform.
Data correspond to usage on the plateform after 2015. The current usage metrics is available 48-96 hours after online publication and is updated daily on week days.
Initial download of the metrics may take a while.