Free Access
Fig. 9
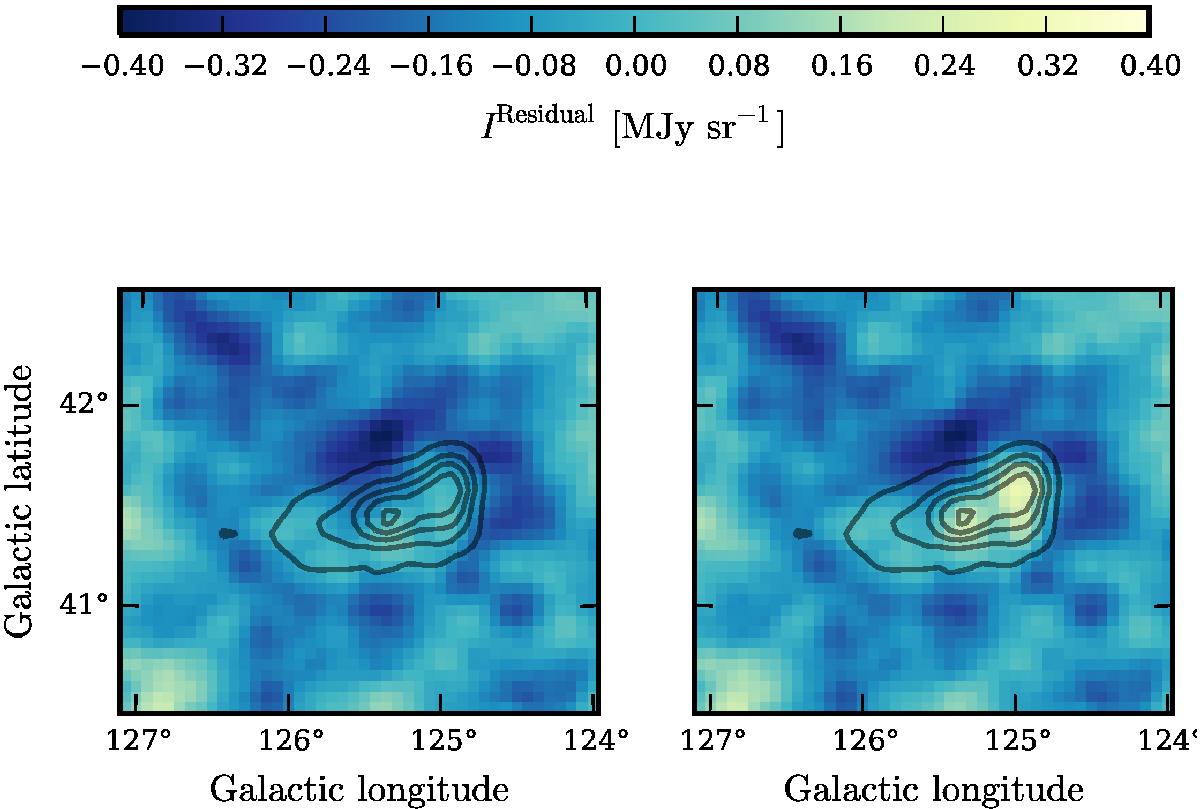
GLM reconstruction of a simulated dusty HVC. The image is dominated by the simulated CIB anisotropies. The HVC dust emissivity corresponds to 10% (left) and 30% (right) of typical Galactic values. The black contours correspond to the HVC column density starting at 1019 cm-2 and increasing in steps of 2 × 1019 cm-2.
Current usage metrics show cumulative count of Article Views (full-text article views including HTML views, PDF and ePub downloads, according to the available data) and Abstracts Views on Vision4Press platform.
Data correspond to usage on the plateform after 2015. The current usage metrics is available 48-96 hours after online publication and is updated daily on week days.
Initial download of the metrics may take a while.