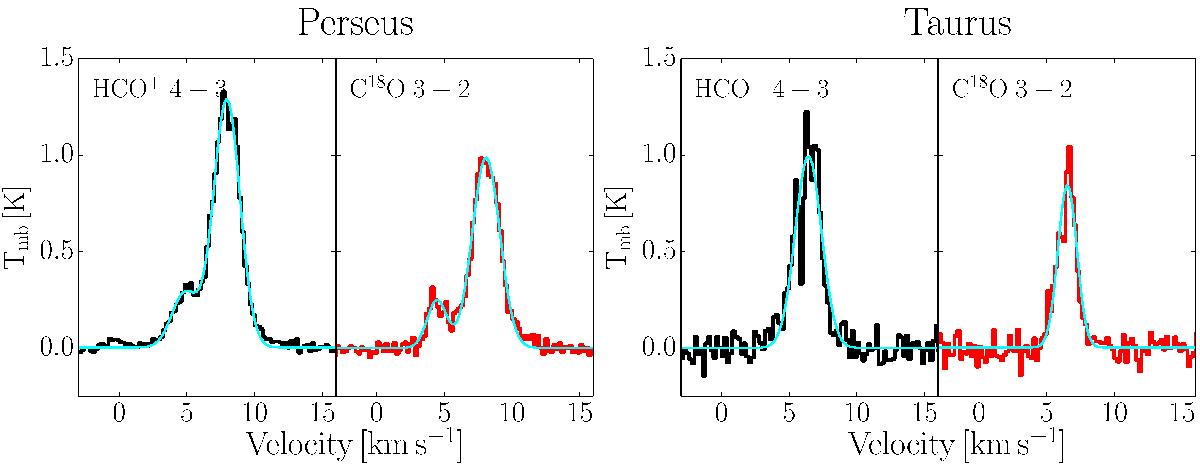
Fig. 1

Cloud-averaged spectra of all sources with detections in HCO+ 4–3 and C18O 3–2. Non-detections are omitted from averaging. The HCO+ 4–3 data are shown in black, the C18O 3–2 in red, and Gaussian fits in cyan. The sum of two 1D Gaussian fits is shown for the Perseus cloud. Perseus shows a clear secondary feature while Taurus is well fit by single Gaussians in both lines. Note that the y-axis scale is 0.25 × the figures presented in Appendix B.
Current usage metrics show cumulative count of Article Views (full-text article views including HTML views, PDF and ePub downloads, according to the available data) and Abstracts Views on Vision4Press platform.
Data correspond to usage on the plateform after 2015. The current usage metrics is available 48-96 hours after online publication and is updated daily on week days.
Initial download of the metrics may take a while.


