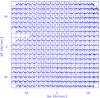
Fig. 2
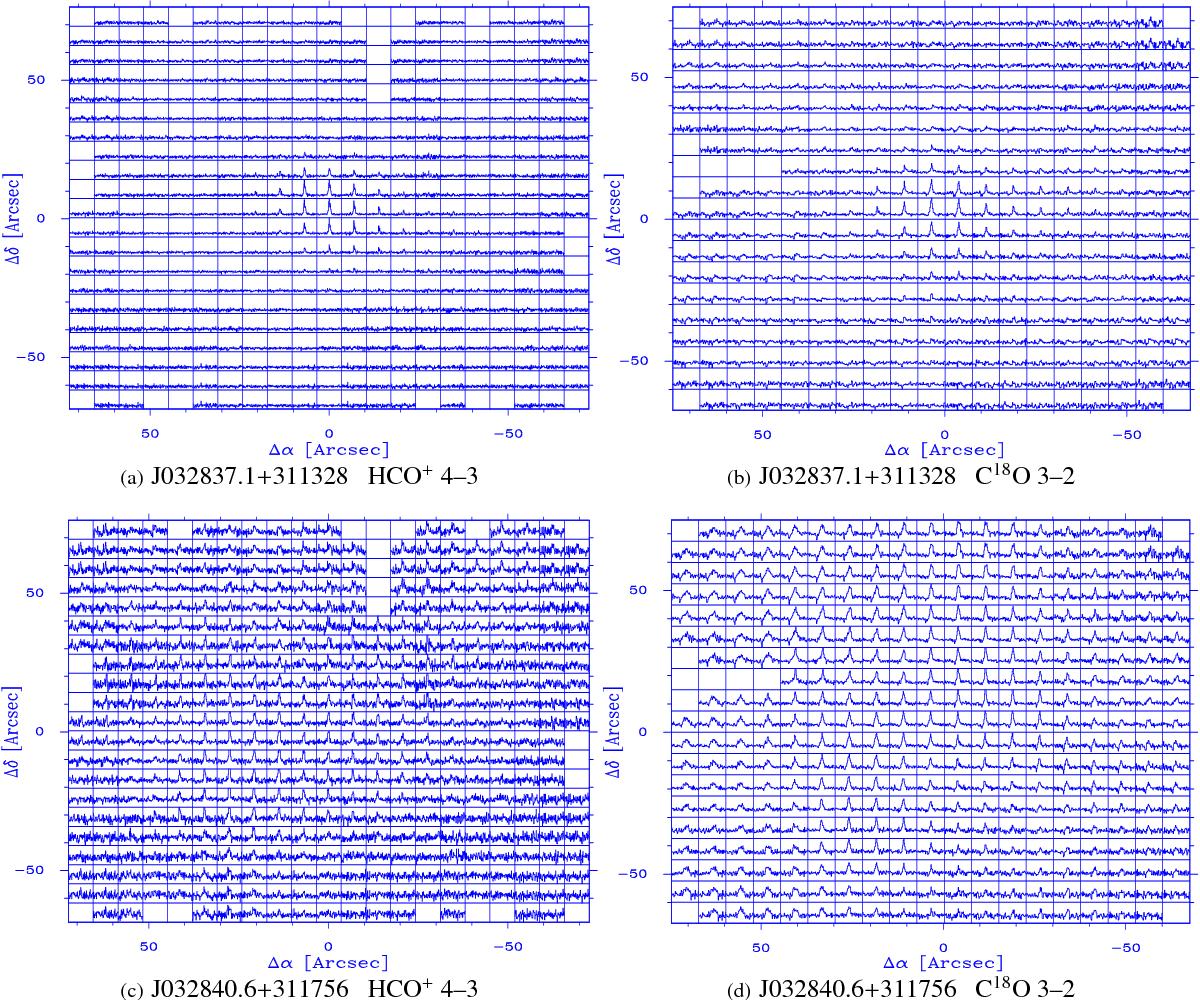
Example of spectral maps obtained by the HARP instrument, visualized in Appendix C. The Tmb maximum value of the central spectrum dictates the scale of the y-axis in each map. a) and b) show the distribution of spectra for J032837.1+311328, a bonafide Stage I source (see Sect. 4.2) with central concentration of emission. c) and d) show the spectral map for a misfit source, J032840.6+311756, with widespread emission in both lines that result in a Stage II classification.
Current usage metrics show cumulative count of Article Views (full-text article views including HTML views, PDF and ePub downloads, according to the available data) and Abstracts Views on Vision4Press platform.
Data correspond to usage on the plateform after 2015. The current usage metrics is available 48-96 hours after online publication and is updated daily on week days.
Initial download of the metrics may take a while.