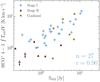
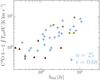
Fig. 5
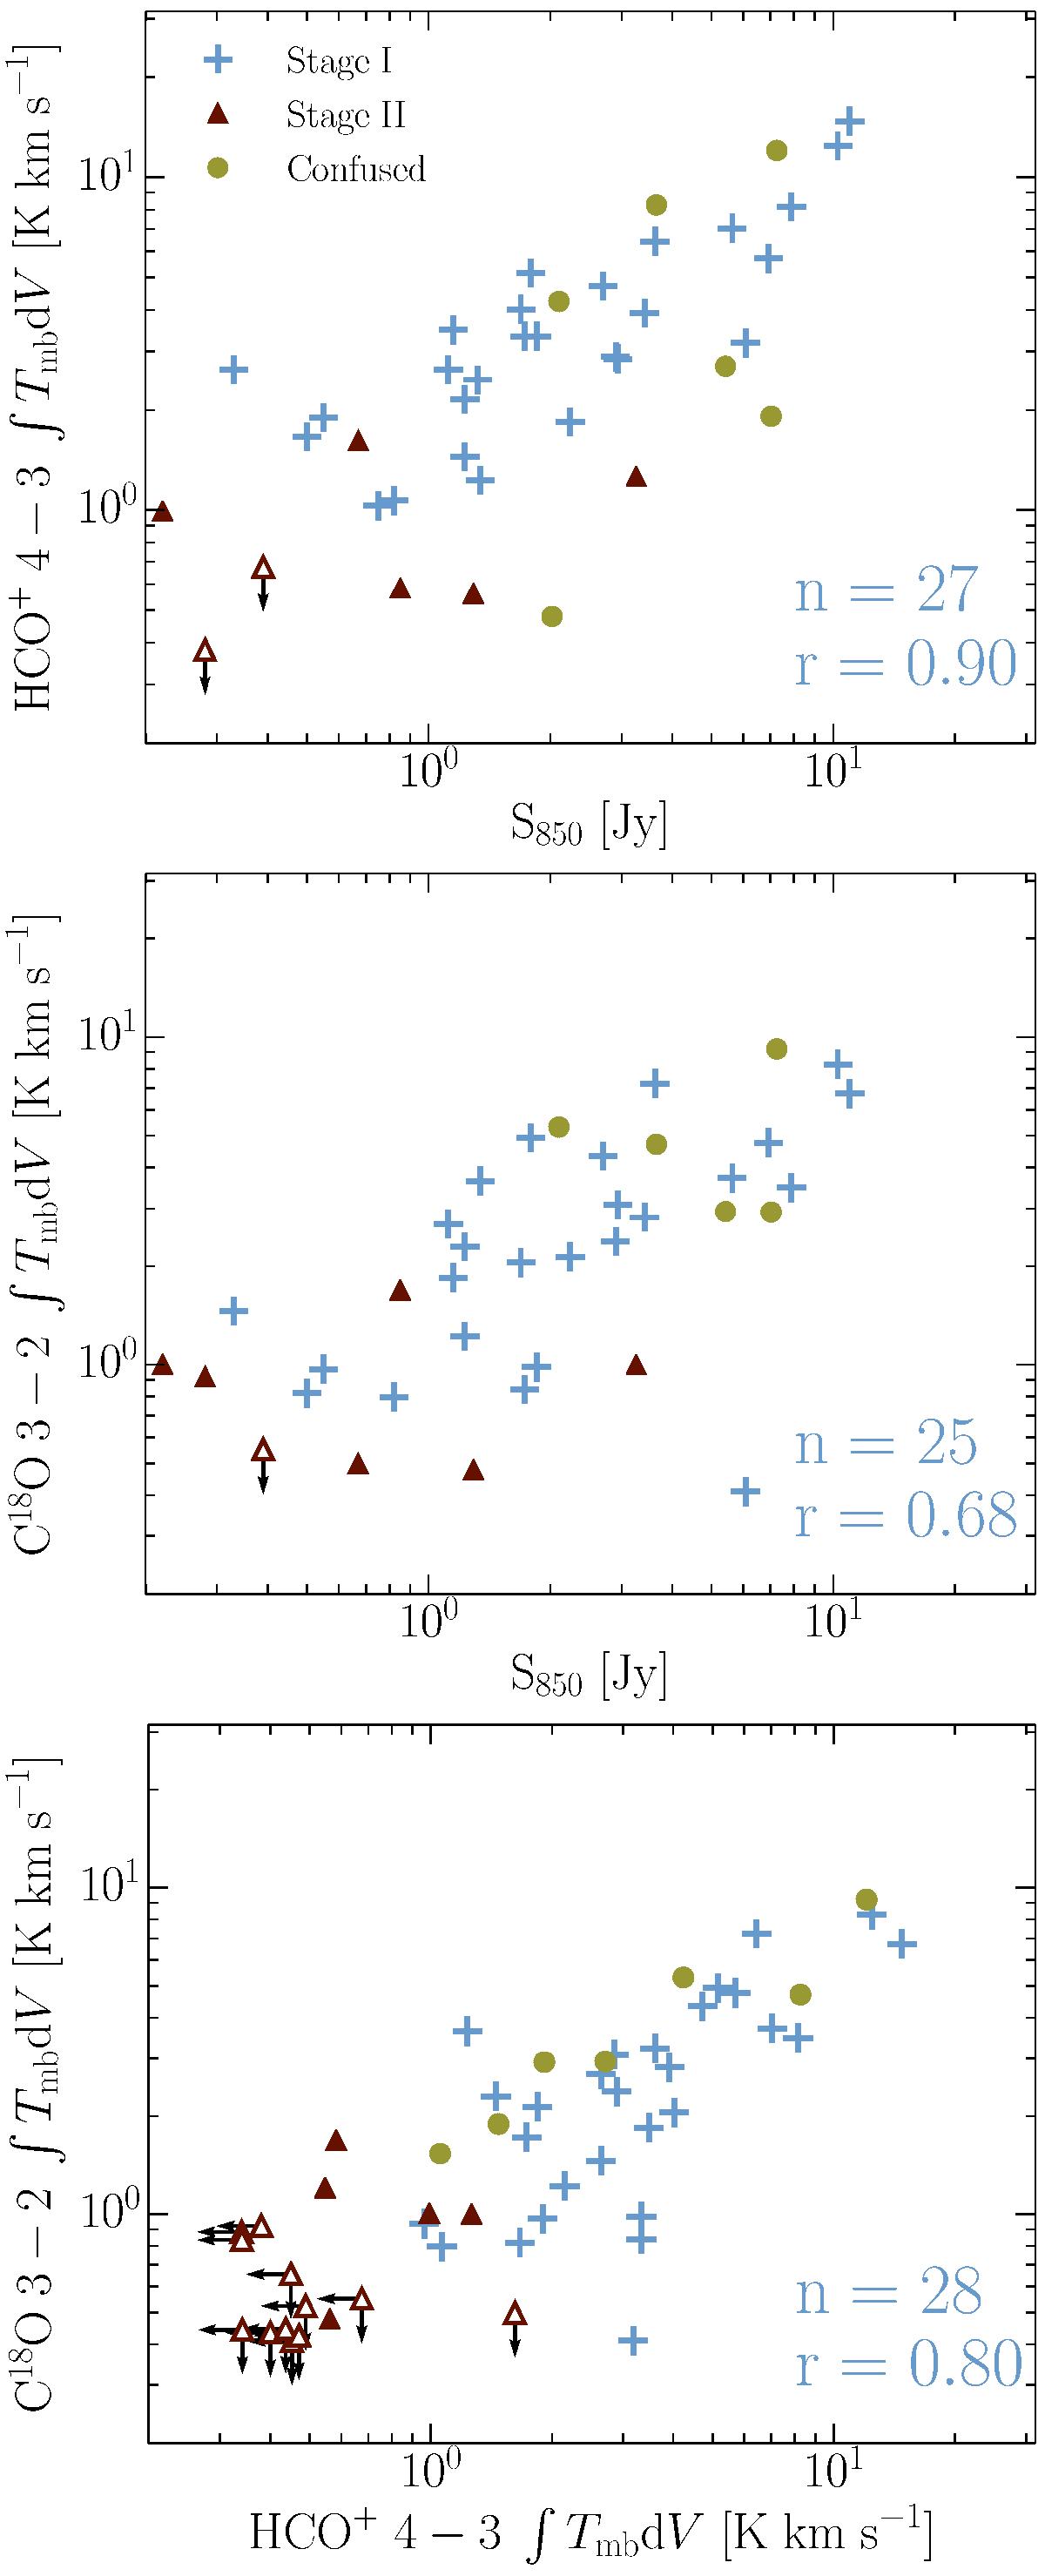
Molecular line intensity and dust continuum flux correlations. Integrated intensities for spectral lines are taken from the central spectrum of each source. Flux values at 850 μm are taken from concentration factor analysis. Stage I (blue cross), Stage II (red triangle), and Confused (green circle) sources are shown. Upper limits are shown in hollow markers with black arrows indicating the bounds. Sample size and Pearson correlation coefficient for Stage I sources are given in the lower-right corner of each plot. Serpens sources are excluded. Top: HCO+ 4–3 versus 850 μm flux Middle: C18O 3–2 versus 850 μm flux Bottom: C18O 3–2 versus HCO+ 4–3.
Current usage metrics show cumulative count of Article Views (full-text article views including HTML views, PDF and ePub downloads, according to the available data) and Abstracts Views on Vision4Press platform.
Data correspond to usage on the plateform after 2015. The current usage metrics is available 48-96 hours after online publication and is updated daily on week days.
Initial download of the metrics may take a while.