Fig. C.1
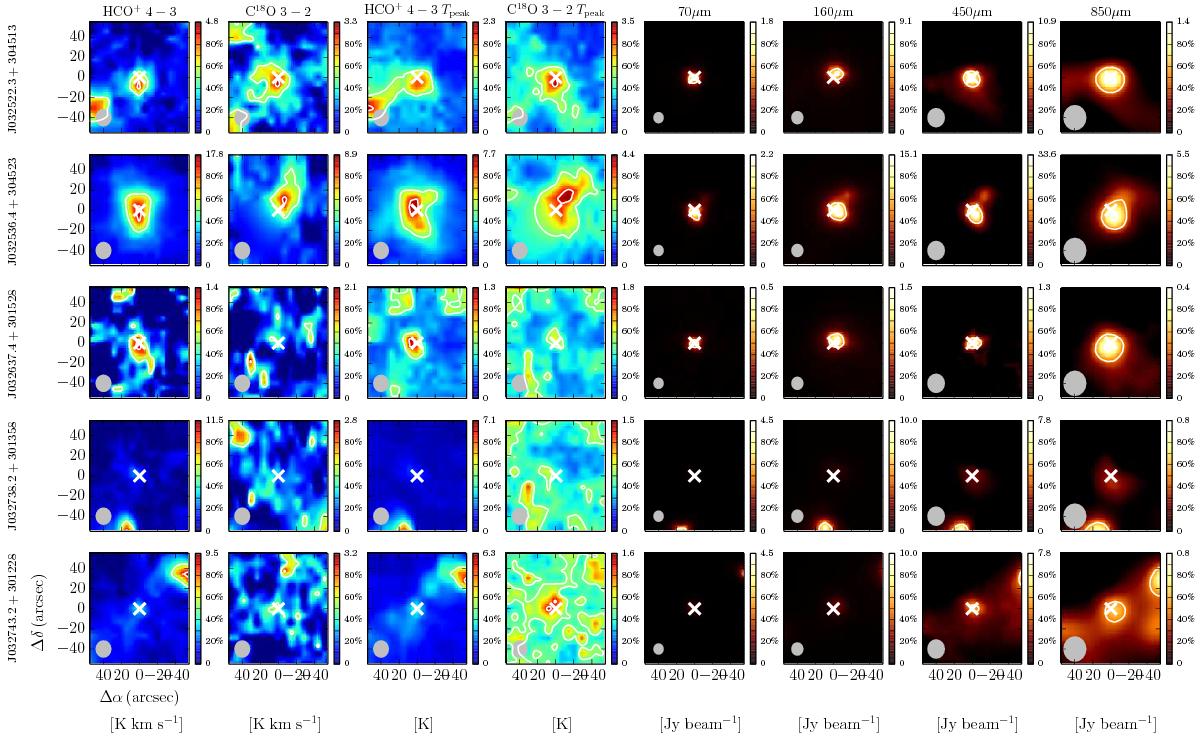
Perseus sources. 2′ × 2′ maps of JCMT HARP HCO+ 4–3 and C18O 3–2, Herschel PACS 70μm and 160μm continuum, and JCMT SCUBA 450 μm and 850 μm continuum. Each map has solid white contours at 50% and 90% of the peak emission. Color scaling is normalized to peak emission and shown as percentage values. Source location based on Table 1 is indicated by a white cross at the center of each image. There are two molecular line maps. The first shows the spectrally integrated intensity over the region. The second shows the peak temperature over the region. Filled gray circles in the lower left give the relevant beam sizes.
Current usage metrics show cumulative count of Article Views (full-text article views including HTML views, PDF and ePub downloads, according to the available data) and Abstracts Views on Vision4Press platform.
Data correspond to usage on the plateform after 2015. The current usage metrics is available 48-96 hours after online publication and is updated daily on week days.
Initial download of the metrics may take a while.