Free Access
Fig. 1
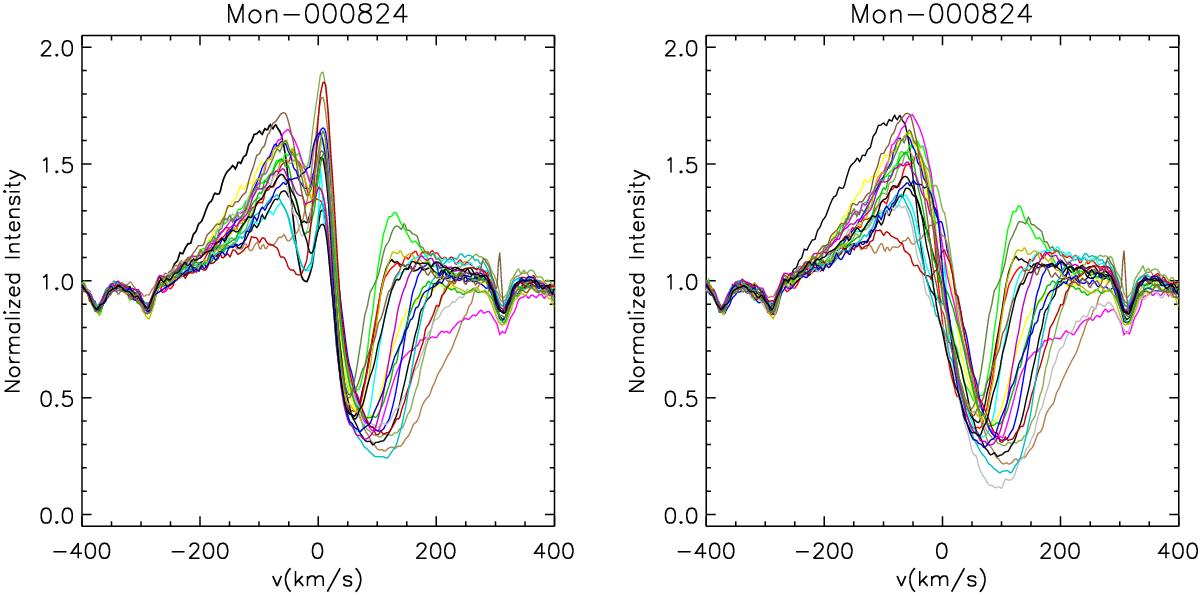
Hα emission lines of a CTTS before (left) and after (right) sky subtraction that show the removal of the nebular emission contribution. The nebular component is the very sharp, narrow emission seen near the line center in the left panel. Different colors correspond to different observing nights.
This figure is made of several images, please see below:
Current usage metrics show cumulative count of Article Views (full-text article views including HTML views, PDF and ePub downloads, according to the available data) and Abstracts Views on Vision4Press platform.
Data correspond to usage on the plateform after 2015. The current usage metrics is available 48-96 hours after online publication and is updated daily on week days.
Initial download of the metrics may take a while.