Free Access
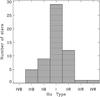
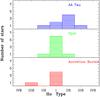
Fig. 12
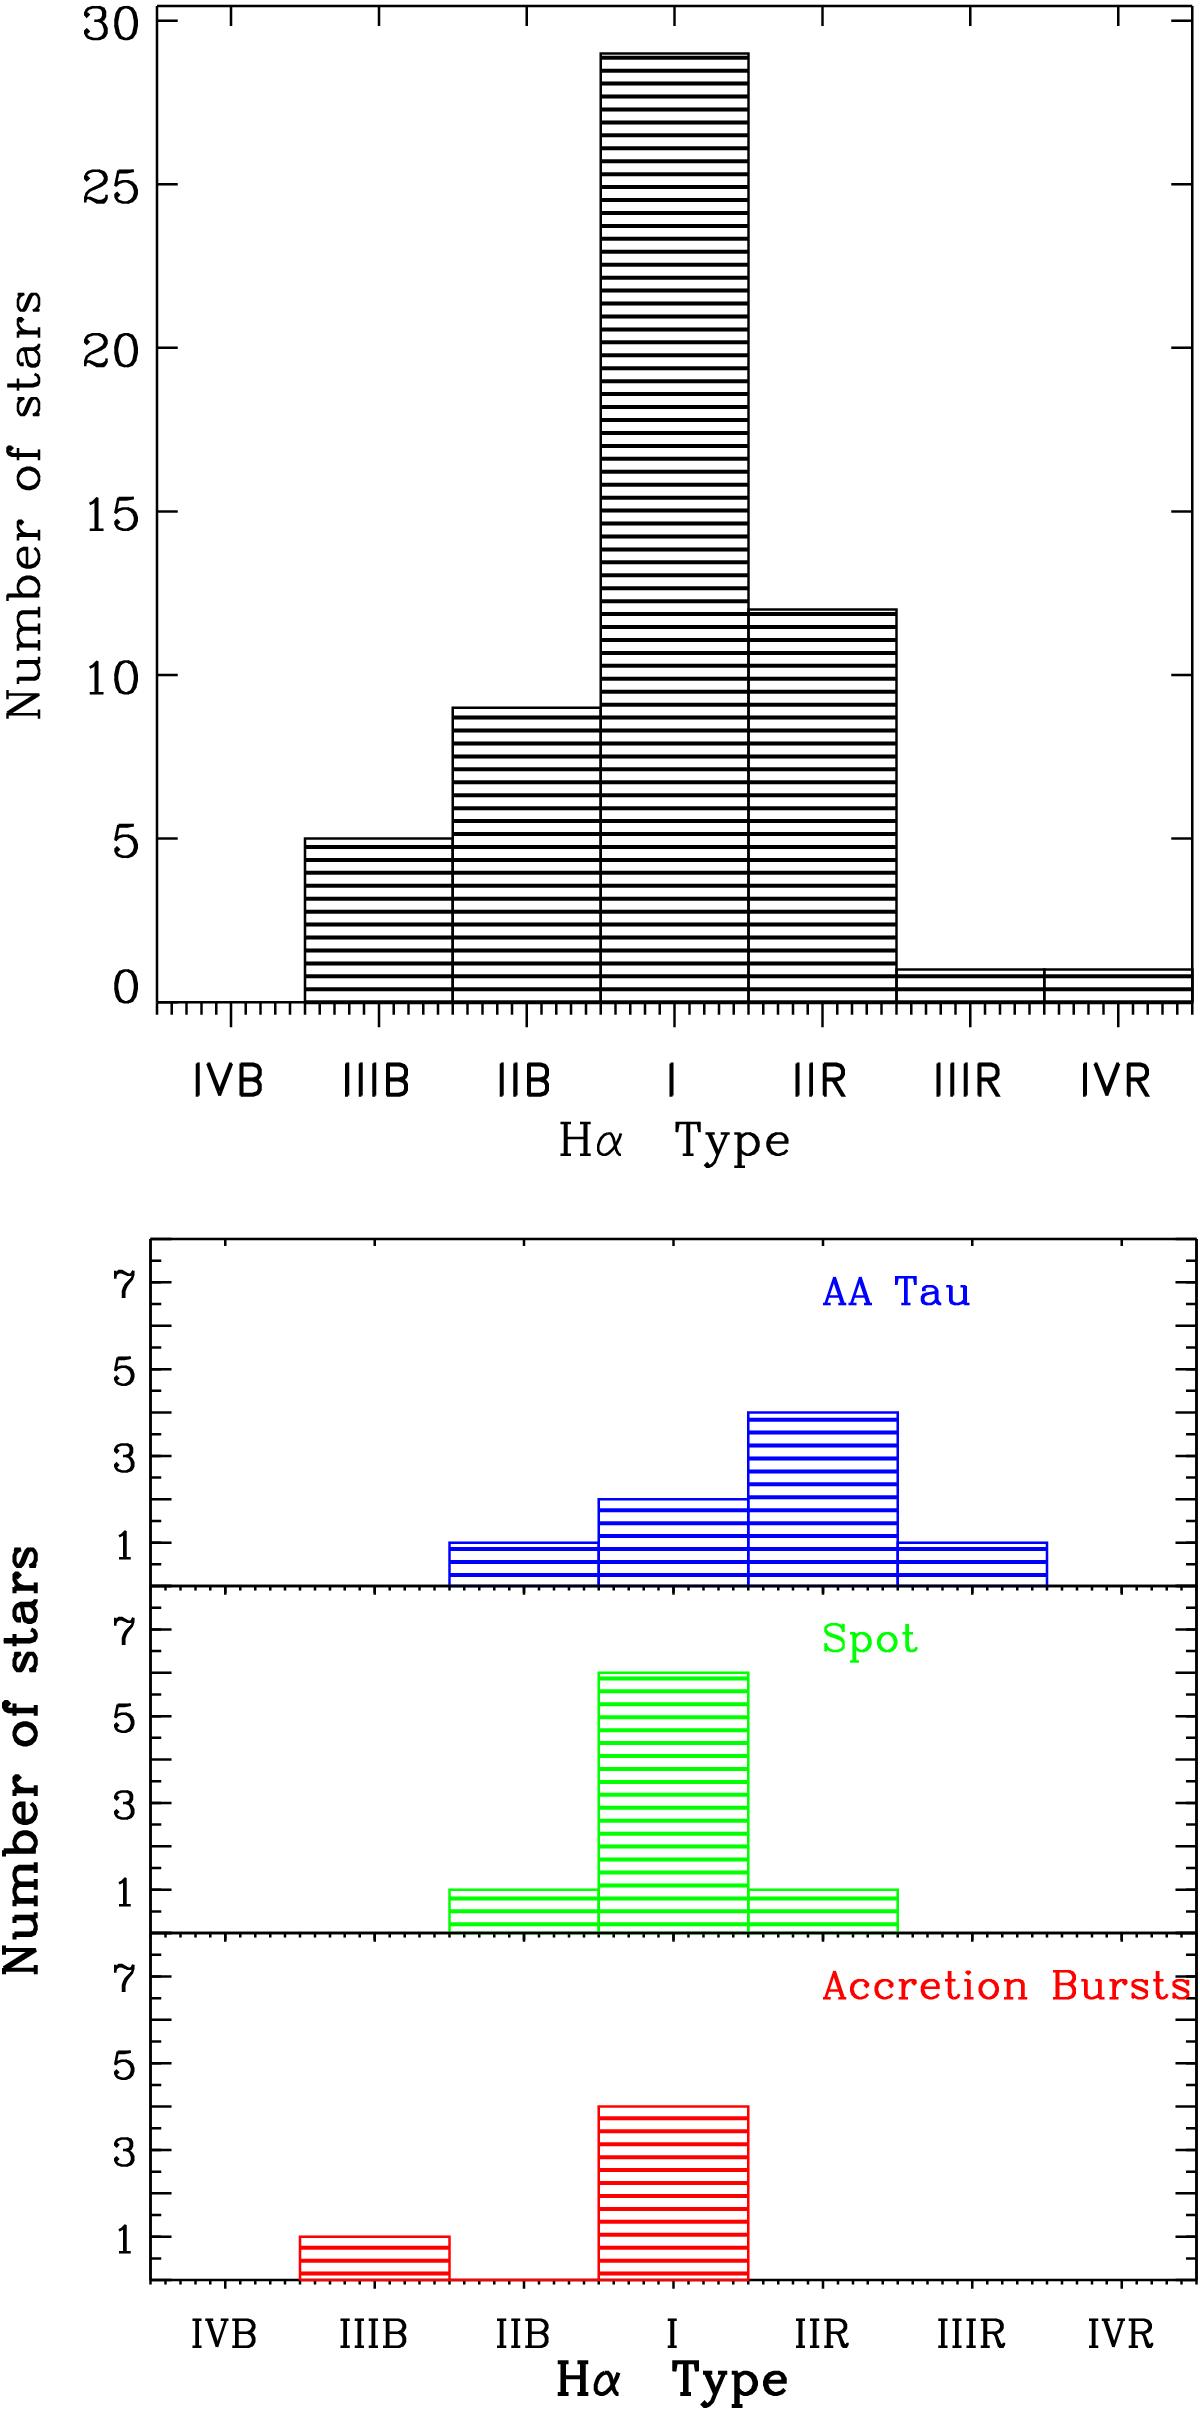
Distribution of Hα profile types according to the classification of Reipurth et al. (1996). Top: all the CTTSs observed with FLAMES. Bottom: CTTSs observed both with FLAMES and CoRoT. Light curves classified as spot-like, AA Tau-like, and accretion burst are shown as a function of profile type.
This figure is made of several images, please see below:
Current usage metrics show cumulative count of Article Views (full-text article views including HTML views, PDF and ePub downloads, according to the available data) and Abstracts Views on Vision4Press platform.
Data correspond to usage on the plateform after 2015. The current usage metrics is available 48-96 hours after online publication and is updated daily on week days.
Initial download of the metrics may take a while.