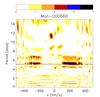
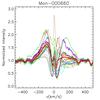
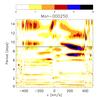
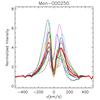
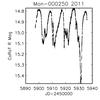
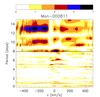
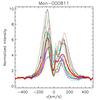
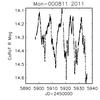
Fig. 13
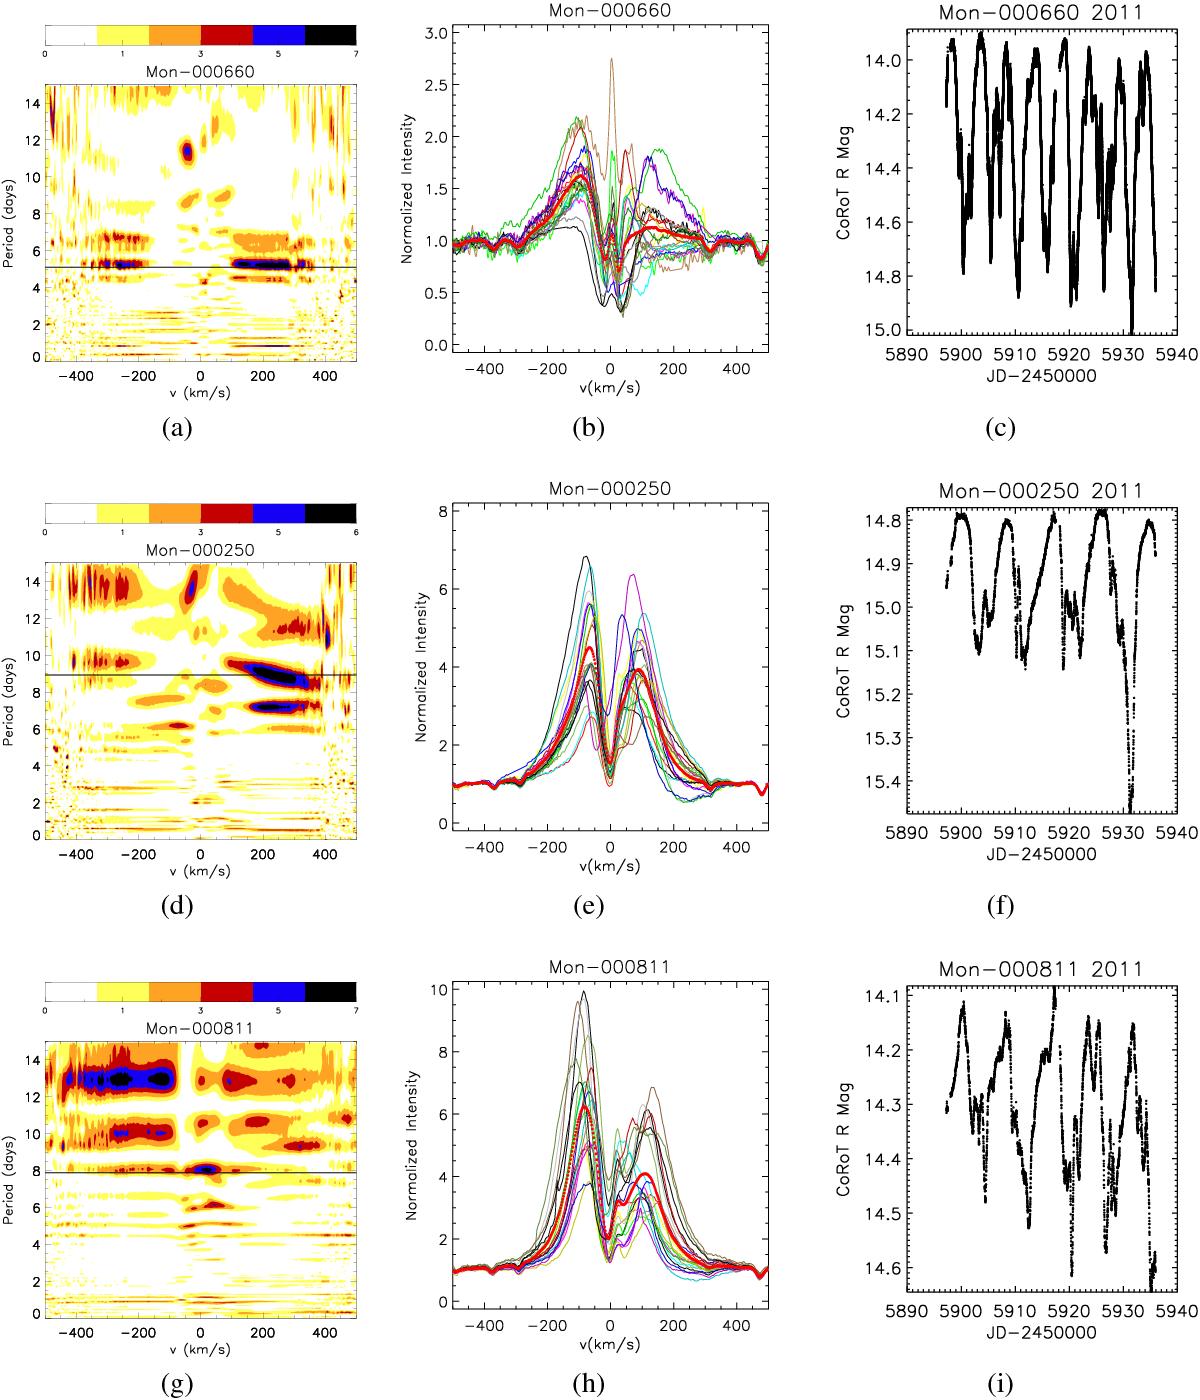
AA Tau-like stars in 2011 that present a periodicity in the Hα line. Left column: bidimensional periodograms of the Hα line. The color code represents the power of periodogram, varying from zero (white) to the maximum power intensity (black). The black horizontal lines correspond to the photometric period of the 2011 CoRoT light curves. Middle column: Hα line profiles. Different colors correspond to different observation nights, and the thick red line is the average line profile. Right column: CoRoT light curves from 2011.
Current usage metrics show cumulative count of Article Views (full-text article views including HTML views, PDF and ePub downloads, according to the available data) and Abstracts Views on Vision4Press platform.
Data correspond to usage on the plateform after 2015. The current usage metrics is available 48-96 hours after online publication and is updated daily on week days.
Initial download of the metrics may take a while.