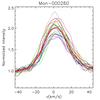
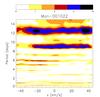
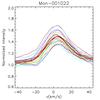
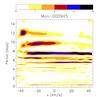
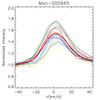
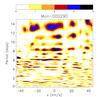
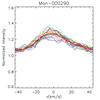
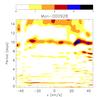
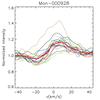
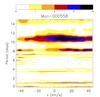
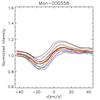
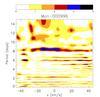
Fig. 18
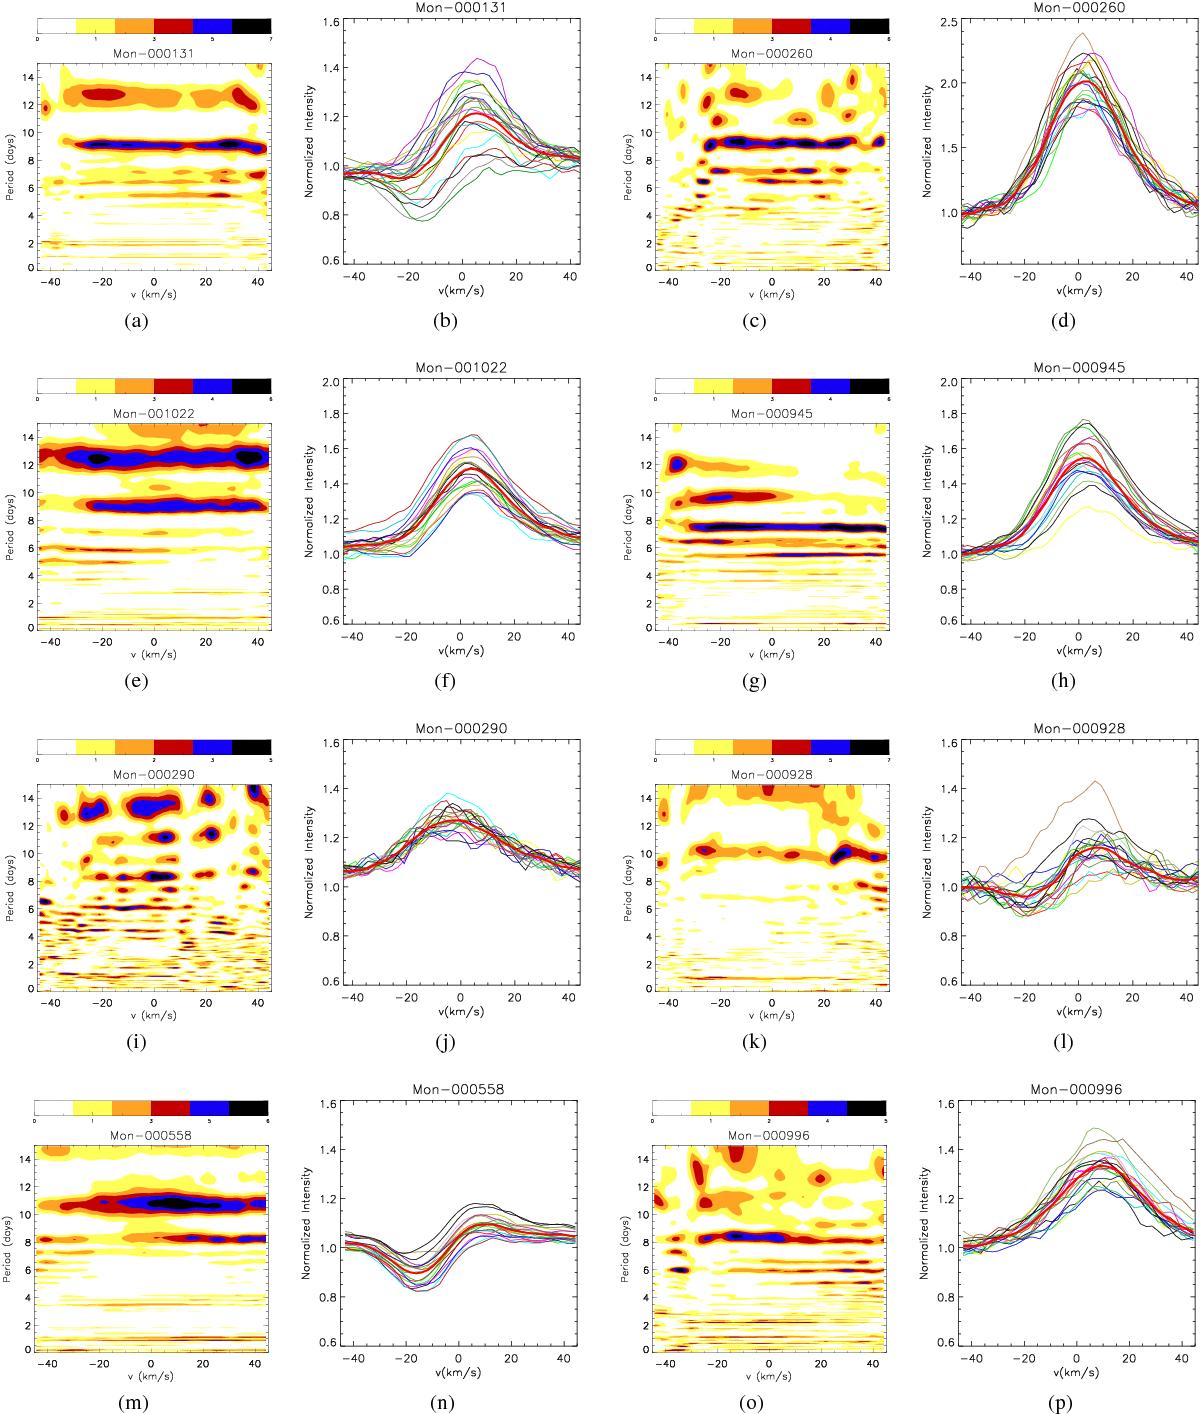
Periodic stars in the HeI ![]() line that did not show a periodicity in the CoRoT light curves. The first and third columns show bidimensional periodograms of the HeI line. The color code represents the power of the periodogram, varying from zero (white) to the maximum power intensity (black). The second and fourth columns show the HeI
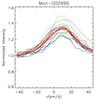
line that did not show a periodicity in the CoRoT light curves. The first and third columns show bidimensional periodograms of the HeI line. The color code represents the power of the periodogram, varying from zero (white) to the maximum power intensity (black). The second and fourth columns show the HeI ![]() lines used to calculate the periodograms. Different colors correspond to different nights of observation, and the thick red line is the average line profile.
lines used to calculate the periodograms. Different colors correspond to different nights of observation, and the thick red line is the average line profile.
Current usage metrics show cumulative count of Article Views (full-text article views including HTML views, PDF and ePub downloads, according to the available data) and Abstracts Views on Vision4Press platform.
Data correspond to usage on the plateform after 2015. The current usage metrics is available 48-96 hours after online publication and is updated daily on week days.
Initial download of the metrics may take a while.