Fig. A.1
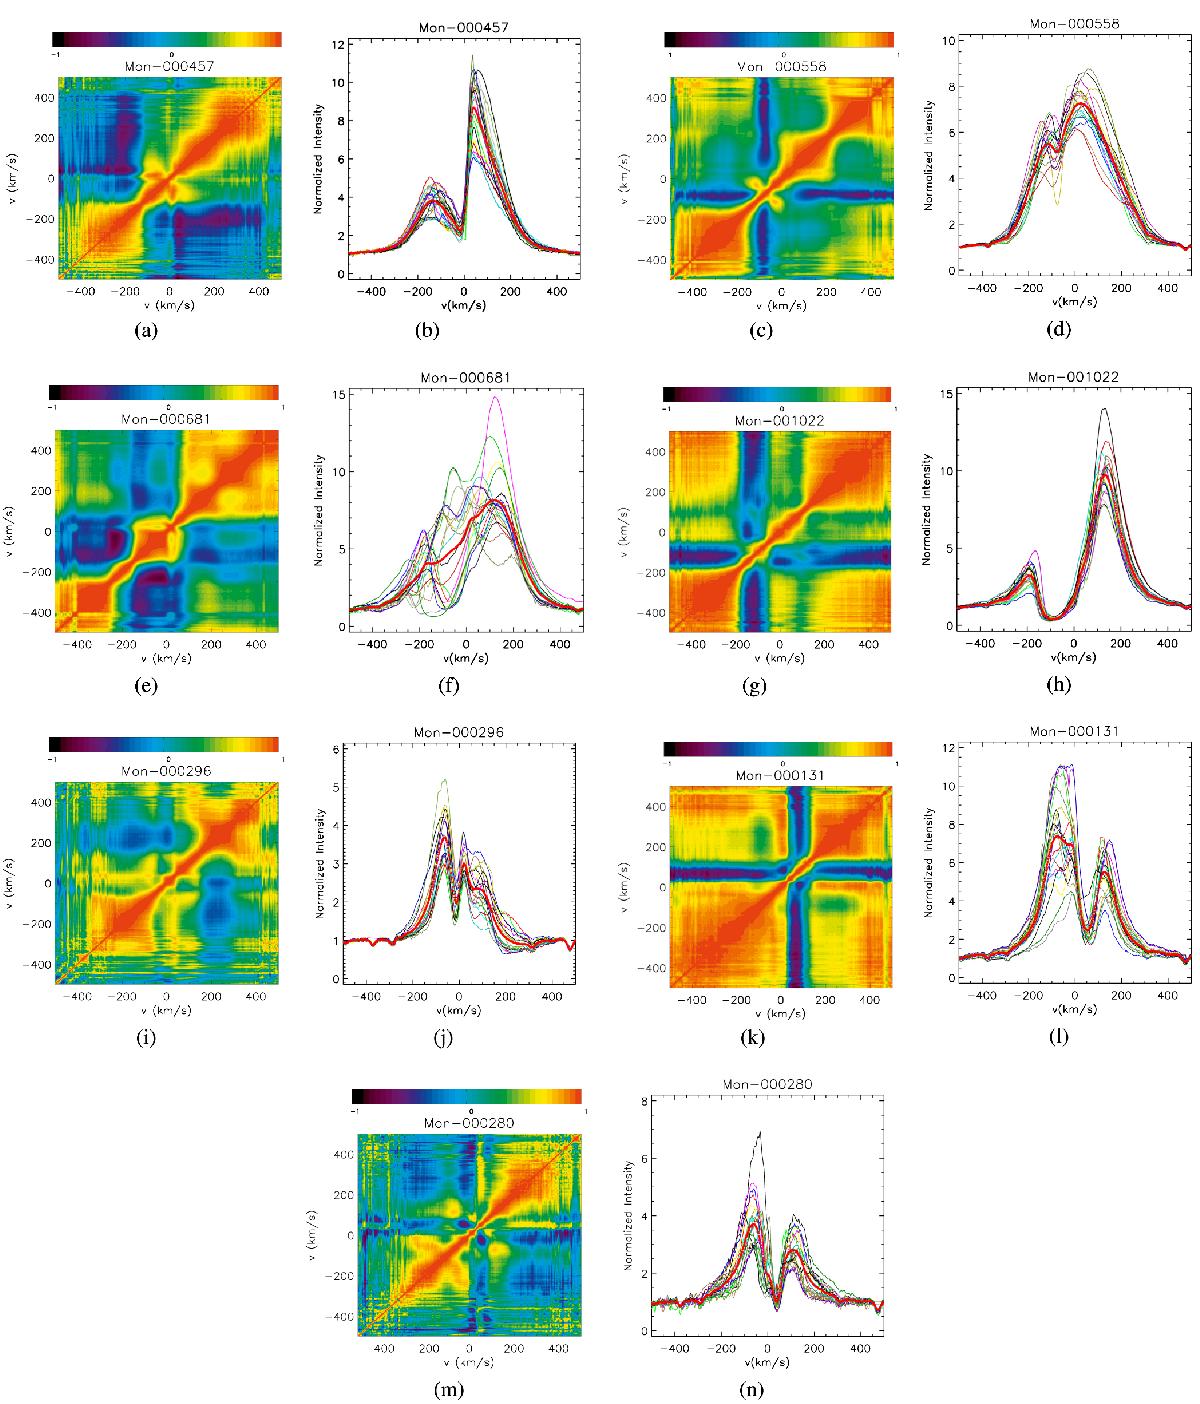
Correlation matrices (left) of the Hα line of selected CTTSs and the corresponding line profiles (right). In the left panels, the color range corresponds to the value of the linear correlation coefficient, r(i,j), between different velocity bins (i and j), of the Hα line profiles, as described in Sect. 11. Perfect anticorrelation corresponds to –1 (black), no correlation to 0 (light blue), and a perfect correlation to 1 (orange). When i = j, r(i,j) = 1, and for all values of i and j, r(i,j) = r(j,i), implying that the matrix is symmetrical relative to the diagonal. In the right panels, different colors correspond to spectra observed in different nights, and the thick red line is the average line profile. The stars in this group present anticorrelation of some part of the line profile. The anticorrelation seen in these stars is associated with blue- or redshifted absorption or emission that varies in antiphase with the rest of the profile. For example, when in panel a (Mon-000457) the red wing emission increases in intensity, the blue wing emission decreases.
Current usage metrics show cumulative count of Article Views (full-text article views including HTML views, PDF and ePub downloads, according to the available data) and Abstracts Views on Vision4Press platform.
Data correspond to usage on the plateform after 2015. The current usage metrics is available 48-96 hours after online publication and is updated daily on week days.
Initial download of the metrics may take a while.