Fig. 3
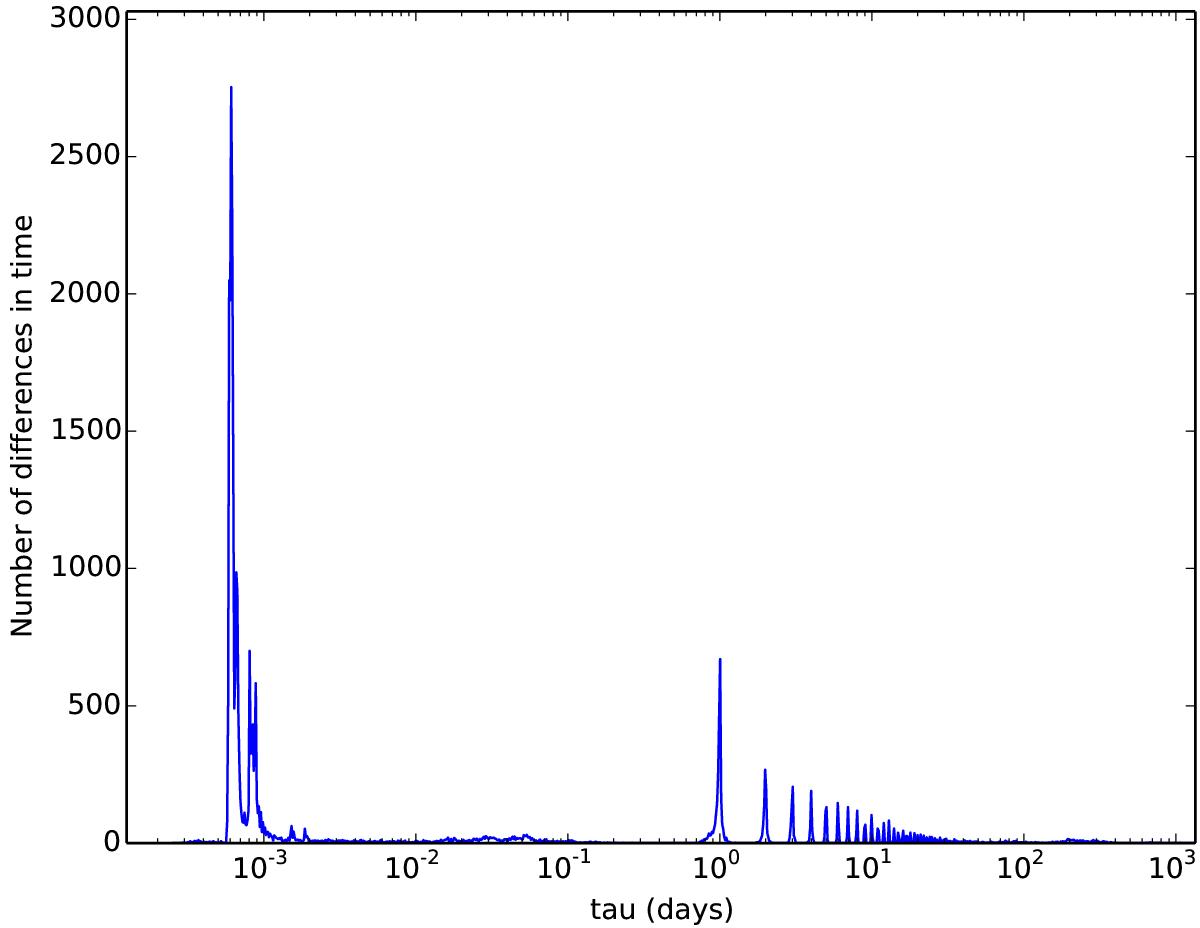
Histogram of the interval between observations for the WFCAMCAL08B data; tau is the interval between any two observations regardless of filter and these are binned logarithmically. The peaks at ~10-3 days are intervals during a ZYJHK sequence and the peaks at ~1 day and multiples of 1day are repeat observations on subsequent nights.
Current usage metrics show cumulative count of Article Views (full-text article views including HTML views, PDF and ePub downloads, according to the available data) and Abstracts Views on Vision4Press platform.
Data correspond to usage on the plateform after 2015. The current usage metrics is available 48-96 hours after online publication and is updated daily on week days.
Initial download of the metrics may take a while.