Fig. 6
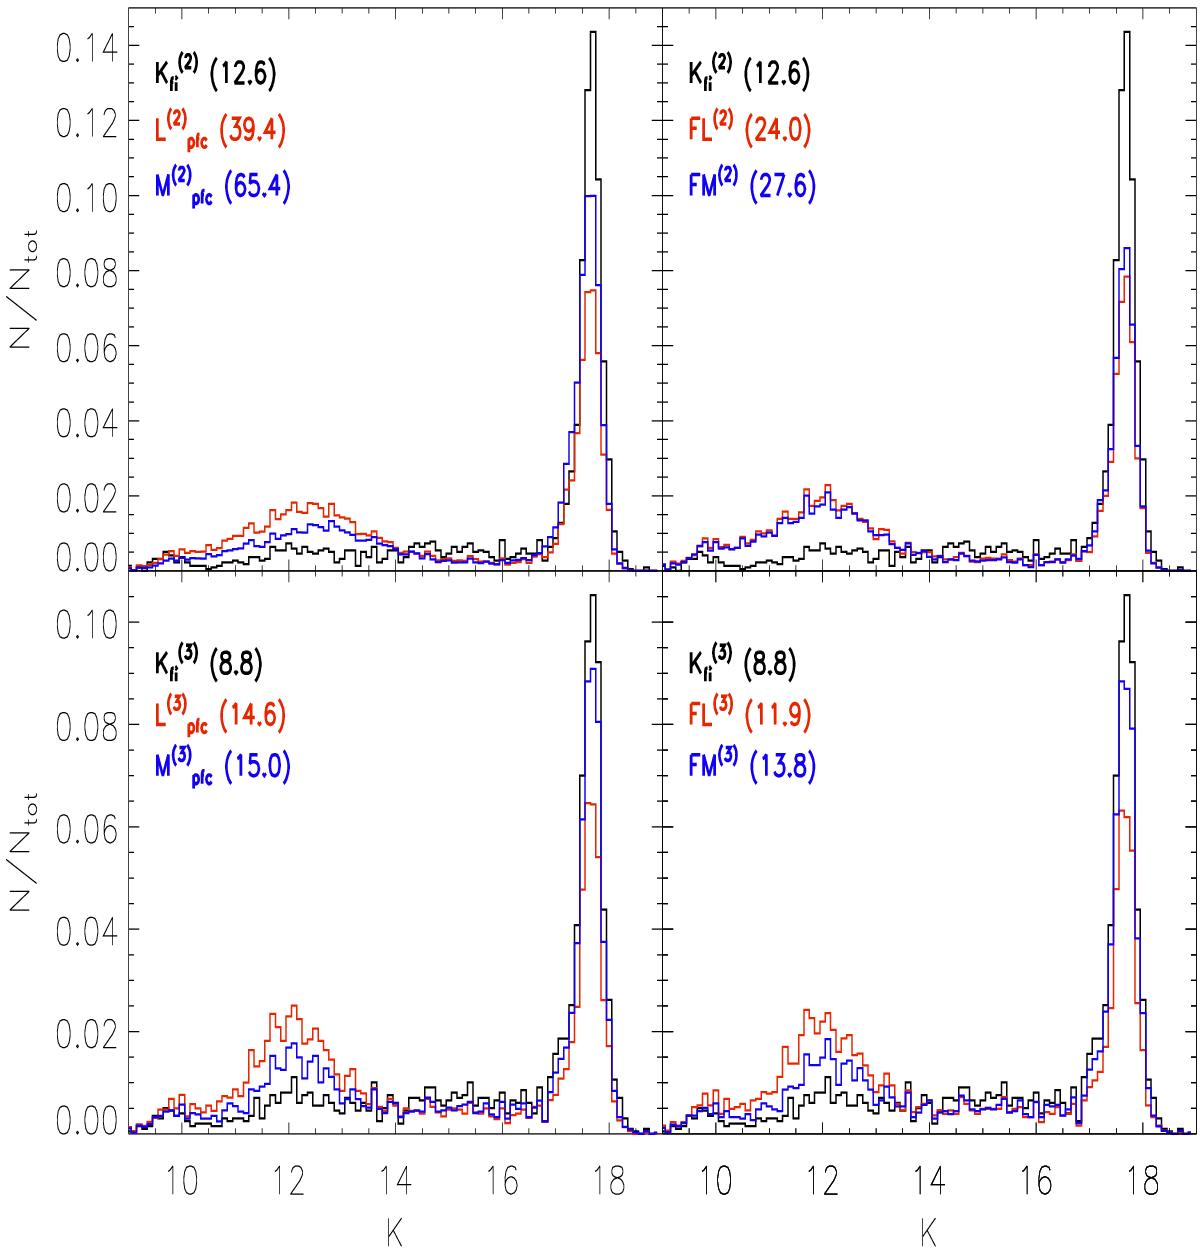
Normalized histograms of the sources selected with a constant cut-off value for ![]() (black line),
(black line), ![]() and FL(s) (red line), and
and FL(s) (red line), and ![]() and FM(s) (blue line) indices. The Etot values for each index is shown in parentheses. The upper panel shows the histograms for s = 2, while the lower panel shows the histograms for s = 3. The cut-off values were determined considering a value that includes 90% of WVSC1 stars (see Table 3).
and FM(s) (blue line) indices. The Etot values for each index is shown in parentheses. The upper panel shows the histograms for s = 2, while the lower panel shows the histograms for s = 3. The cut-off values were determined considering a value that includes 90% of WVSC1 stars (see Table 3).
Current usage metrics show cumulative count of Article Views (full-text article views including HTML views, PDF and ePub downloads, according to the available data) and Abstracts Views on Vision4Press platform.
Data correspond to usage on the plateform after 2015. The current usage metrics is available 48-96 hours after online publication and is updated daily on week days.
Initial download of the metrics may take a while.