Fig. 2
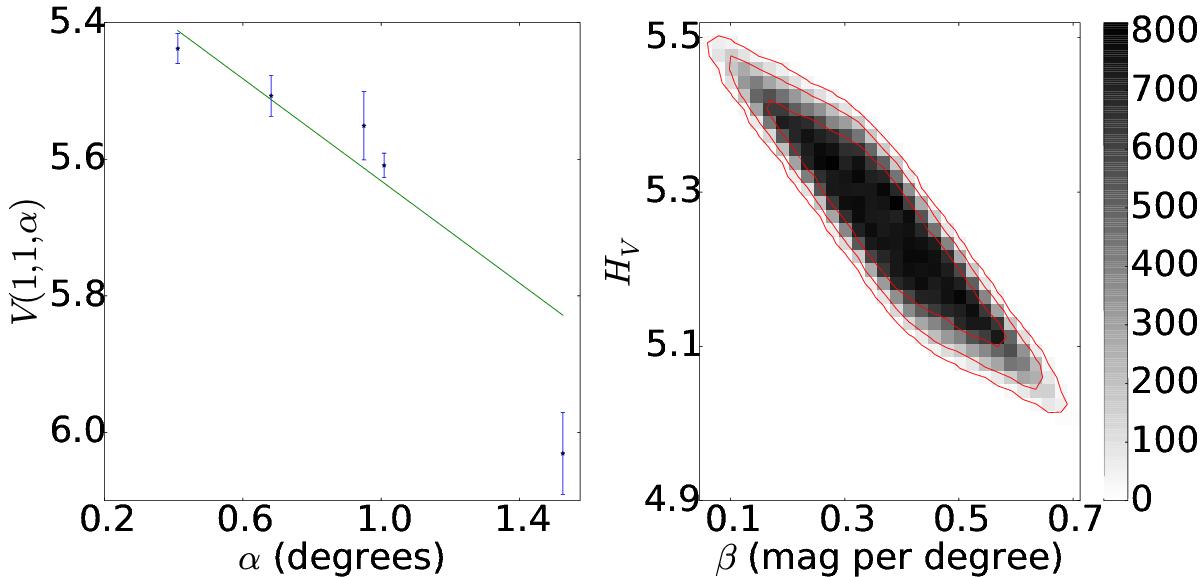
Example of phase curve of 1996 TL66. Left: scatter plot of V(1,1,α) versus α. The line represents the solution for HV and β as mentioned in the text. Right: density plot showing the phase space of solutions of Eq. (5) when Δm ≠ 0, in gray scale. The effect of the Δm may cause values between 5.0 and 5.5 for HV, while the same is true for β ∈ (0.041,0.706) mag per degree. The continuous lines (red) show the area that contains 68.3, 95.5, and 99.7% of the solutions.
Current usage metrics show cumulative count of Article Views (full-text article views including HTML views, PDF and ePub downloads, according to the available data) and Abstracts Views on Vision4Press platform.
Data correspond to usage on the plateform after 2015. The current usage metrics is available 48-96 hours after online publication and is updated daily on week days.
Initial download of the metrics may take a while.