Fig. 1
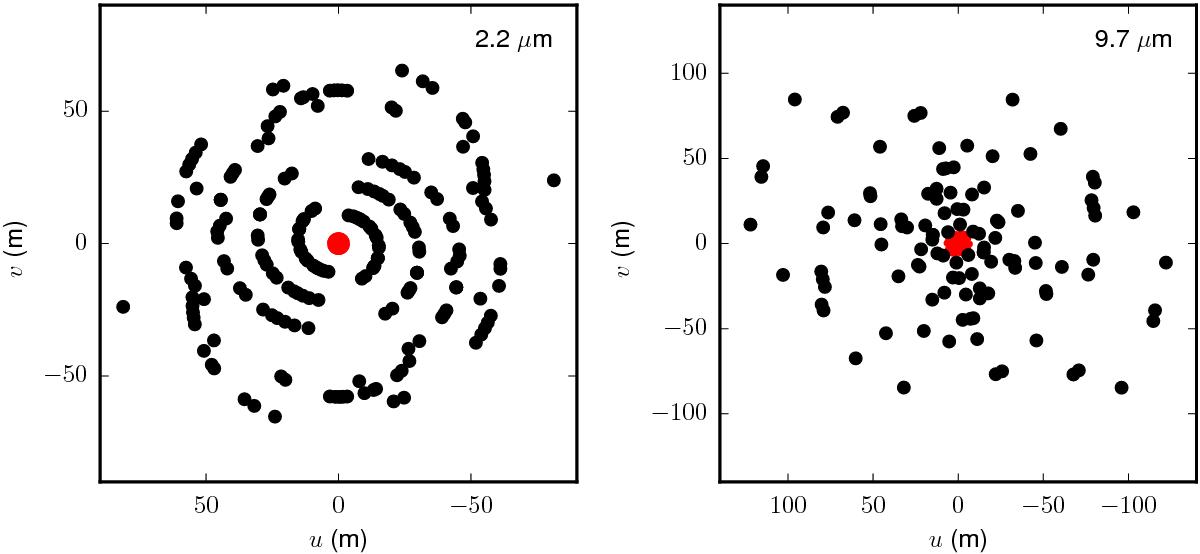
uv coverage of the interferometric measurements. The left panel shows the coverage of the near-infrared measurements, while the right panel shows the coverage of the mid-infrared measurements. Black points show the long-baseline VLTI observations (AMBER and MIDI), while the speckle-interferometry and aperture-masking observations (NTT and GSO/T-ReCS) are shown in red.
Current usage metrics show cumulative count of Article Views (full-text article views including HTML views, PDF and ePub downloads, according to the available data) and Abstracts Views on Vision4Press platform.
Data correspond to usage on the plateform after 2015. The current usage metrics is available 48-96 hours after online publication and is updated daily on week days.
Initial download of the metrics may take a while.