Free Access
Fig. 2
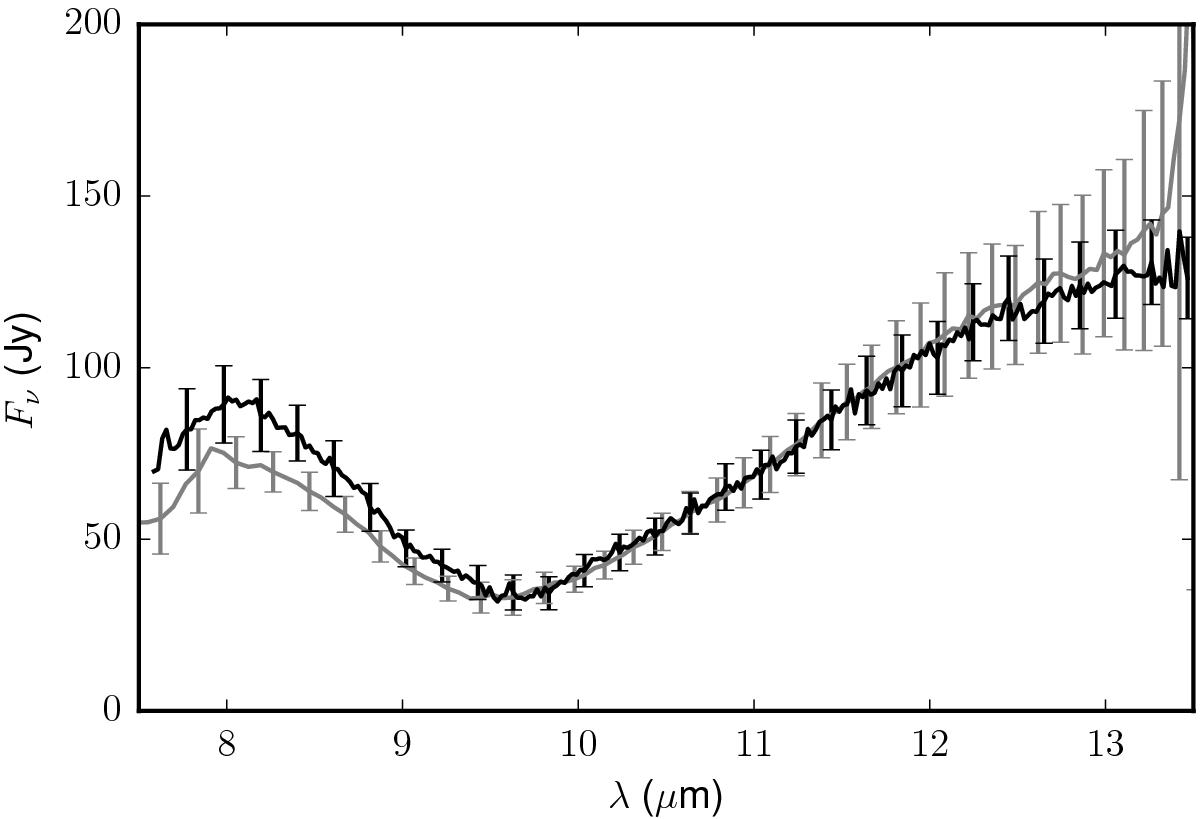
Total N-band spectrum of IRAS 13481-6124. The gray line shows the spectrum observed with the prism (Boley et al. 2013); the black line shows the spectrum measured with the grism.
Current usage metrics show cumulative count of Article Views (full-text article views including HTML views, PDF and ePub downloads, according to the available data) and Abstracts Views on Vision4Press platform.
Data correspond to usage on the plateform after 2015. The current usage metrics is available 48-96 hours after online publication and is updated daily on week days.
Initial download of the metrics may take a while.