Fig. 3
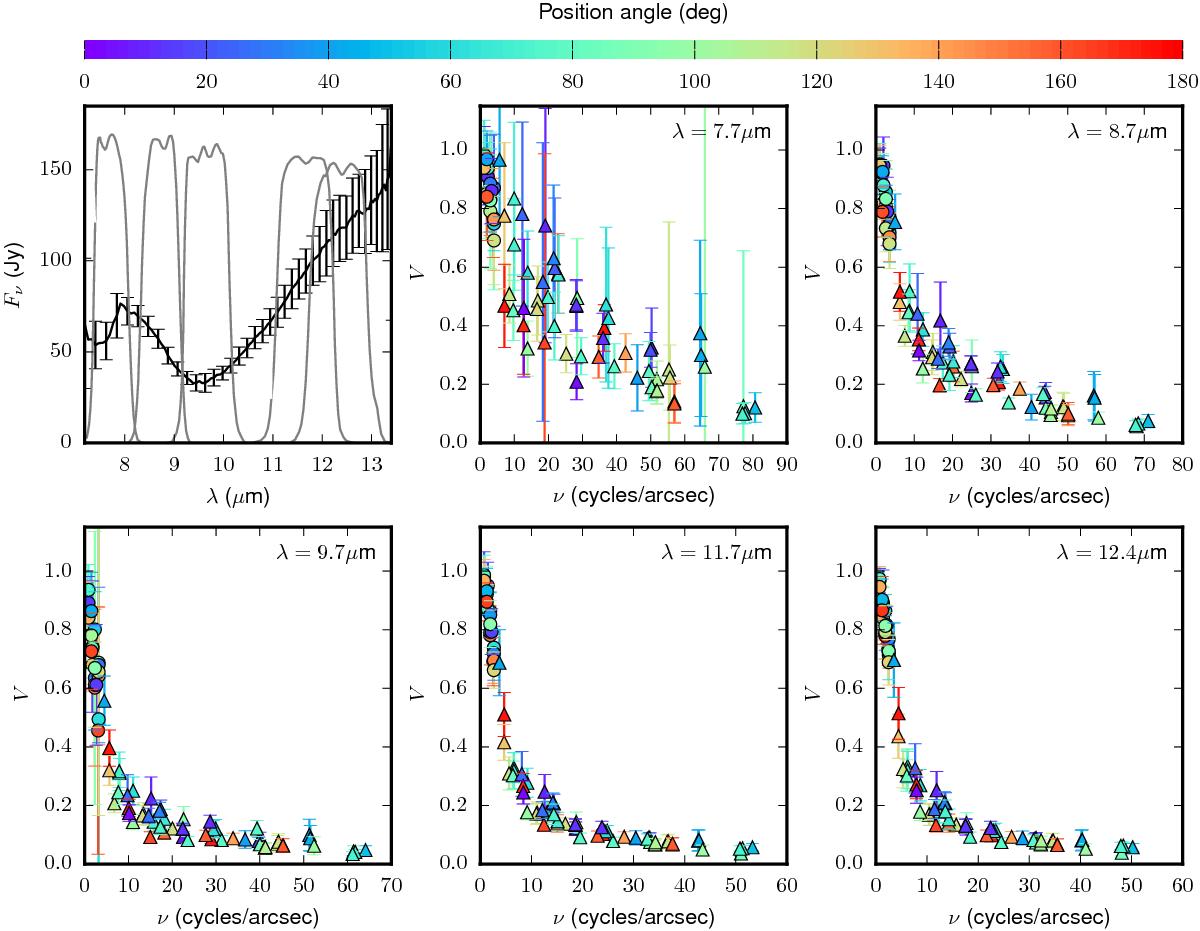
Top left panel: total N-band spectrum observed with MIDI (black) and the transmission curves for the five filters used for the T-ReCS aperture-masking measurements. Remaining panels: the visibility amplitude V as a function of spatial frequency ν in each of the five filters. The T-ReCS measurements are shown as circles, while the MIDI measurements, averaged over each corresponding filter, are shown as triangles. The color of each data point shows the position angle (measured east of north).
Current usage metrics show cumulative count of Article Views (full-text article views including HTML views, PDF and ePub downloads, according to the available data) and Abstracts Views on Vision4Press platform.
Data correspond to usage on the plateform after 2015. The current usage metrics is available 48-96 hours after online publication and is updated daily on week days.
Initial download of the metrics may take a while.