Fig. 7
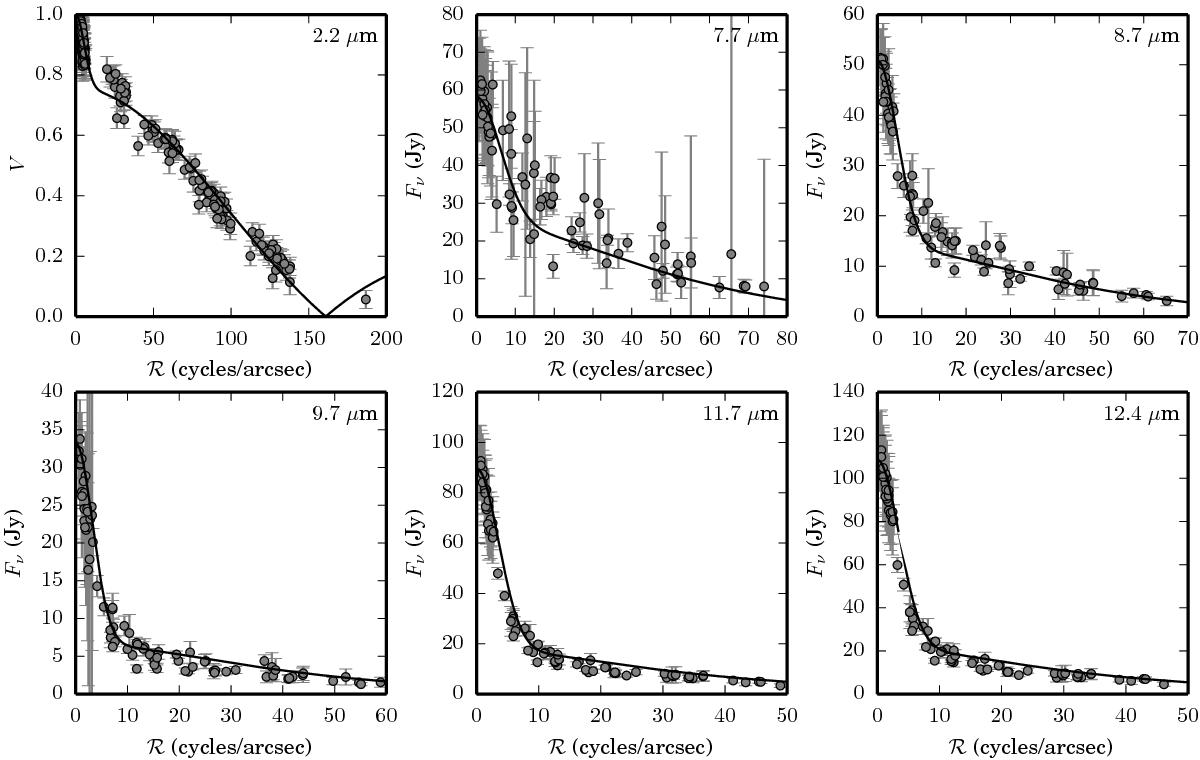
Temperature-gradient disk model fits to the K-band visibilities and N-band correlated fluxes (with Tin treated as a free parameter), plotted as a function of deprojected spatial frequency. See Table 3 (Model 2) for the fit parameters. Circles and error bars mark the observations, while the model fits to each wavelength are shown as a solid curve.
Current usage metrics show cumulative count of Article Views (full-text article views including HTML views, PDF and ePub downloads, according to the available data) and Abstracts Views on Vision4Press platform.
Data correspond to usage on the plateform after 2015. The current usage metrics is available 48-96 hours after online publication and is updated daily on week days.
Initial download of the metrics may take a while.