Fig. 9
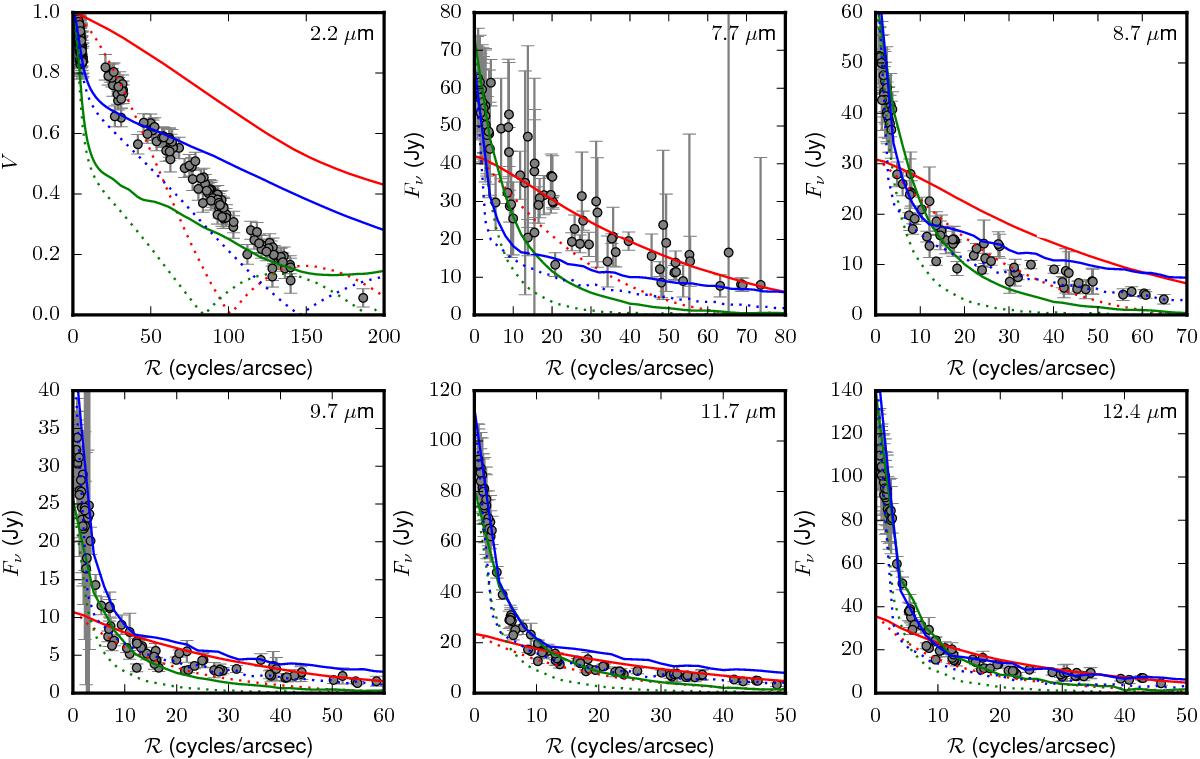
Visibility/correlated flux levels predicted by radiative-transfer models, plotted as a function of deprojected spatial frequency. The observations are shown in gray. The disk-only model is shown in red, the envelope-only model is shown in green, and the combined disk and envelope model is shown in blue, where the solid and dotted lines show the visibility perpendicular and parallel to the disk, respectively. See Table 4 for the fit parameters.
Current usage metrics show cumulative count of Article Views (full-text article views including HTML views, PDF and ePub downloads, according to the available data) and Abstracts Views on Vision4Press platform.
Data correspond to usage on the plateform after 2015. The current usage metrics is available 48-96 hours after online publication and is updated daily on week days.
Initial download of the metrics may take a while.