Fig. 4
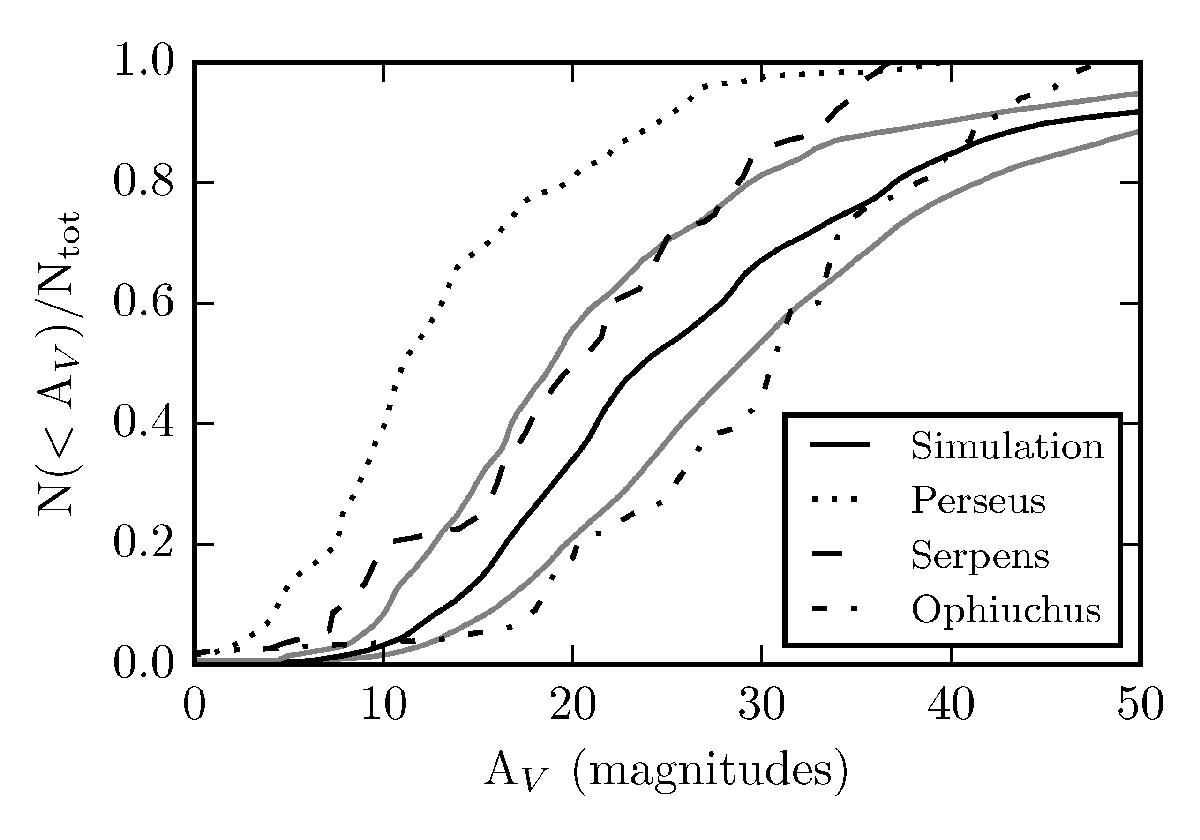
Cumulative distributions of visual extinctions of cores in the simulation, along with observations of Perseus, Serpens, and Ophiuchus from Enoch et al. (2007). The black solid line the simulated extinction curve, assuming a resolution of 90′′ and a distance of 250 pc. The grey solid lines show the effect of increasing/decreasing the resolution by a factor of four.
Current usage metrics show cumulative count of Article Views (full-text article views including HTML views, PDF and ePub downloads, according to the available data) and Abstracts Views on Vision4Press platform.
Data correspond to usage on the plateform after 2015. The current usage metrics is available 48-96 hours after online publication and is updated daily on week days.
Initial download of the metrics may take a while.