Fig. 6
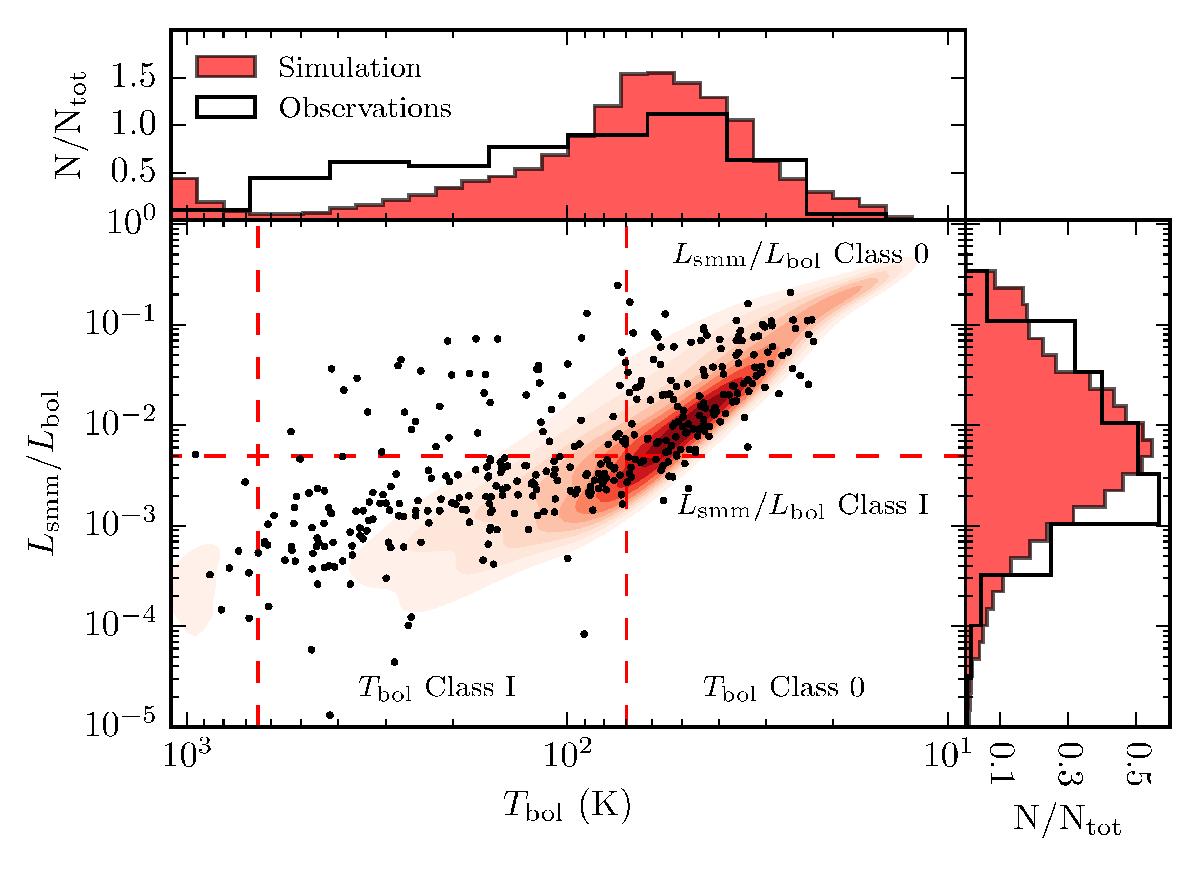
Distribution of Tbol and Lsmm/Lbol, for the protostars in the simulation (red contours), and from observations (black dots). The contour levels cover 90%, 80%, 70%, ...of the simulated points. The marginal distributions of each variable are shown as histograms at the edges. The observations are a conjunction of data from c2d, GB, and HOPS (see Dunham et al. 2014). Protostars are expected to evolve from upper right to lower left. For the fraction of (synthetic) points recorded in each quadrant see Table 4.
Current usage metrics show cumulative count of Article Views (full-text article views including HTML views, PDF and ePub downloads, according to the available data) and Abstracts Views on Vision4Press platform.
Data correspond to usage on the plateform after 2015. The current usage metrics is available 48-96 hours after online publication and is updated daily on week days.
Initial download of the metrics may take a while.