Fig. 10
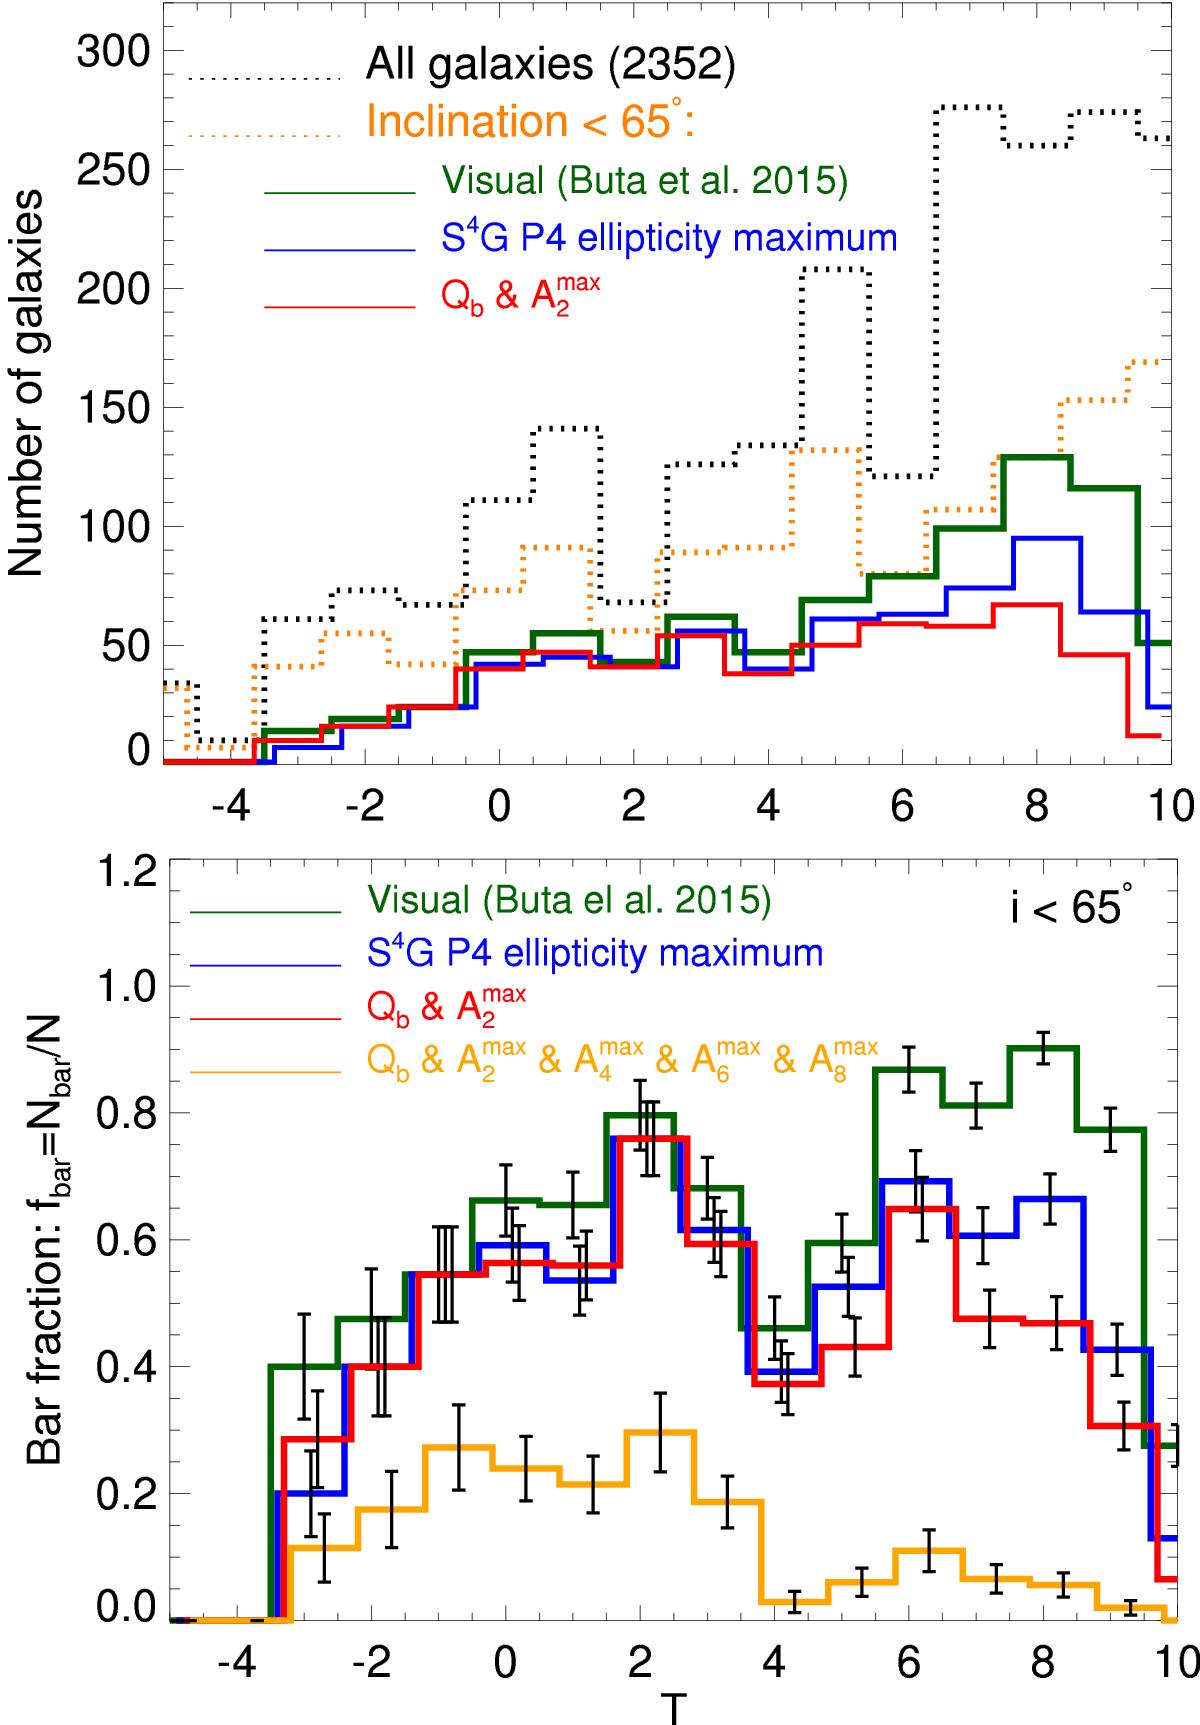
Upper panel: distribution of galaxies in our sample vs. their Hubble type. The black and orange dotted lines correspond to the histogram of all the S4G galaxies and those with inclination lower than 65°, respectively. For the galaxies with i< 65°, we display the histogram of barred galaxies in the Hubble sequence (solid lines), according to the various criteria explained in the text. Lower panel: bar fraction vs. Hubble stage for a sample of face-on and moderately inclined galaxies (i< 65°). The fraction of galaxies with an identifiable maximum in the amplitude of their higher order even Fourier components is also shown. Uncertainties are calculated assuming a binomial distribution.

Current usage metrics show cumulative count of Article Views (full-text article views including HTML views, PDF and ePub downloads, according to the available data) and Abstracts Views on Vision4Press platform.
Data correspond to usage on the plateform after 2015. The current usage metrics is available 48-96 hours after online publication and is updated daily on week days.
Initial download of the metrics may take a while.