Fig. 11
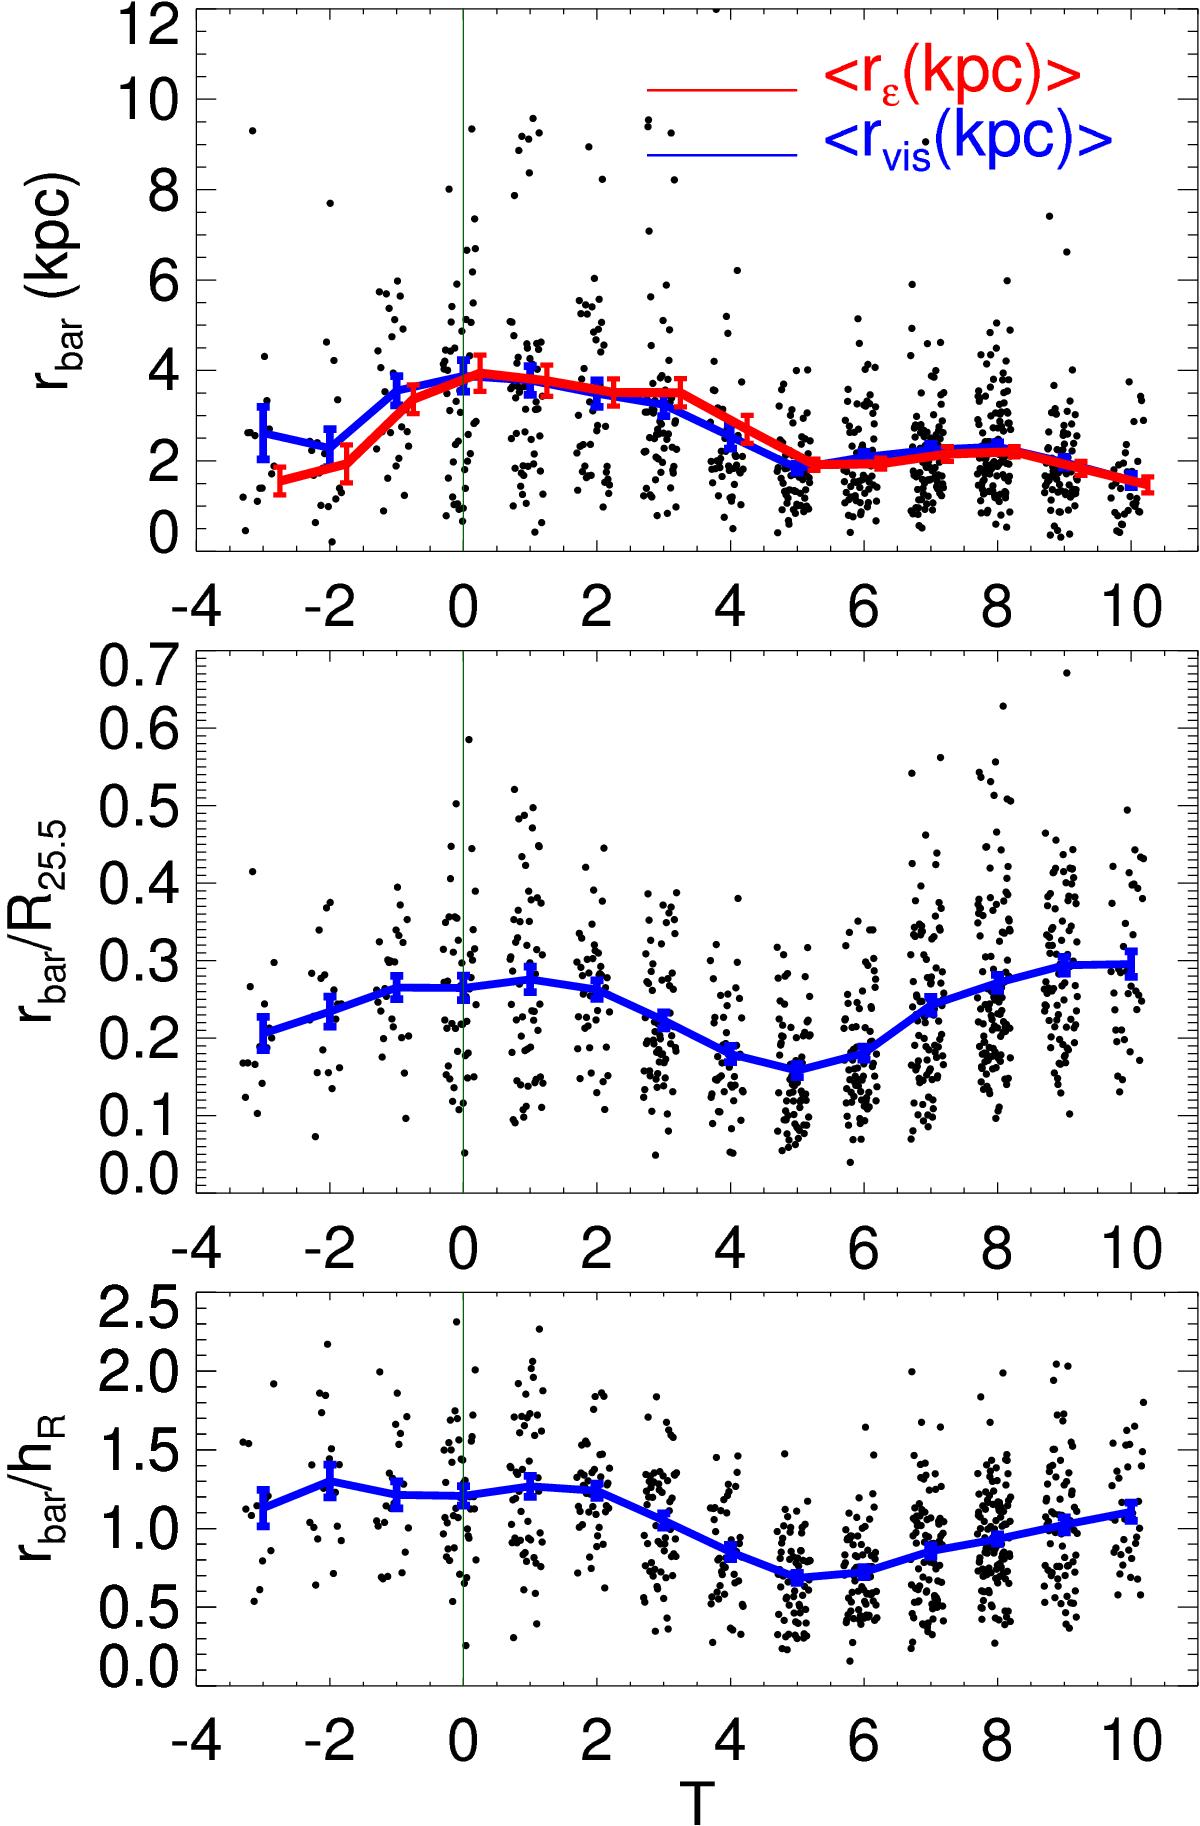
Bar length distribution in terms of the galaxy Hubble stage. The blue line corresponds to the running mean, with the standard error of the mean indicated with an error bar. The green vertical line delimits the region of S0 galaxies. The first row displays the bar length (in units of kpc) vs. T. The red line shows the running mean of the radius of maximum ellipticity, with an offset of + 0.25 in the x-axis. Shown in the second and third rows are the distributions of bar length (visual estimate), normalized by R25.5 and hR. To avoid overlapping of points, the T values in the x-axis have been randomly displaced from the integer.
Current usage metrics show cumulative count of Article Views (full-text article views including HTML views, PDF and ePub downloads, according to the available data) and Abstracts Views on Vision4Press platform.
Data correspond to usage on the plateform after 2015. The current usage metrics is available 48-96 hours after online publication and is updated daily on week days.
Initial download of the metrics may take a while.