Fig. 17
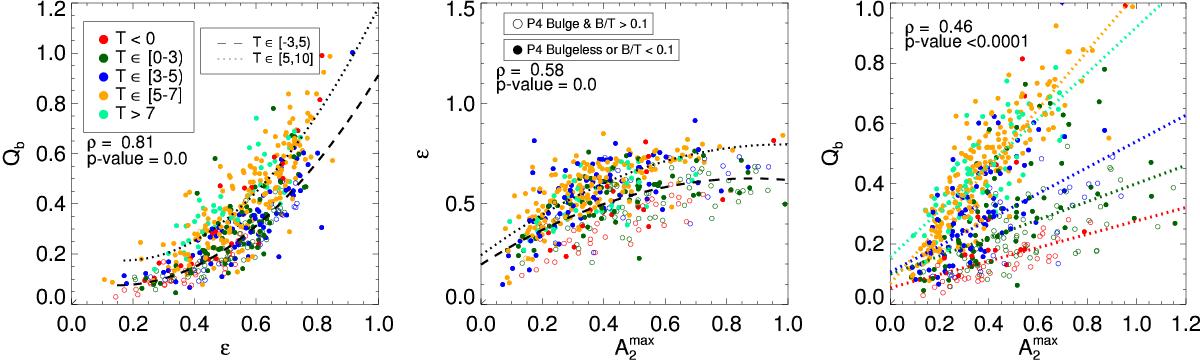
Comparison of bar strength indexes. Galaxies are separated into T bins. Spearman’s rank correlation coefficients (together with the significance) are indicated in all the plots for the total sample (see Table 4 for the different morphological types). Systems with relatively massive (faint) bulges are plotted with filled (empty) circles. In the left and central panels, the dotted and dashed lines display a second-order polynomial fit to the data separately for T< 5 and T ≥ 5, respectively. In the right panel we show the linear fits for different morphological classes.
Current usage metrics show cumulative count of Article Views (full-text article views including HTML views, PDF and ePub downloads, according to the available data) and Abstracts Views on Vision4Press platform.
Data correspond to usage on the plateform after 2015. The current usage metrics is available 48-96 hours after online publication and is updated daily on week days.
Initial download of the metrics may take a while.